Jackson Hole 2016 has come and gone and Fed members seem determined to raise rates at least once before year end. Based on the comments and conversations, the markets quickly adjusted to factoring in one hike in the September to December time frame.
But without sure signs of accelerating jobs or other economic growth, it is uncertain if there will be further rate hikes after the token one to come this year. So, we will all go back to closely watching the economic and corporate datapoints while keeping the corner of our eye on any Breaking News headlines.
Speaking of Breaking News headlines… The script from the EpiPen/Mylan (NASDAQ:MYL) saga could rival Michael Clayton. It was unfortunate timing for those investors who were riding the Healthcare subway last week when Hillary’s tweet released a box of crickets and worms into the sector. And, just when biotech and drug CEOs were looking forward to a year away from the Congressional hot seat. But the good news is that the new Watergate Hotel is open and it looks great. Just ask for the Mylan group rate.
While the Fed speak last week sparked the U.S. dollar and short-term interest rates, it is uncertain if equity and risk investors are spooked. While the markets did sell off on Friday, trading remains very thin with the end of summer holidays still impacting. In looking at the numbers from last week, what does seem more certain is that investors continue to shift into more traditionally higher risk investments. Into Cyclicals like Technology and Banks and out of defensive income proxies. Into Junk and Emerging Market fixed income and out of Treasuries. Into EM Equities and out of domestic and developed Equities. The U.S. dollar could be a thorn for a shift into these riskier investments, but if the markets become convinced that the Fed is one and done until 2017, then the Dollar could take a back seat as investments move into these newer areas of risk.
So unless the economy or global financial markets completely fall apart, we are getting a Fed Funds rate increase before year end…
“In light of the continued solid performance of the labor market and our outlook for economic activity and inflation, I believe the case for an increase in the federal funds rate has strengthened in recent months,” Ms. Yellen said in remarks delivered here Friday.
The remarks left the door open for a Fed rate increase at its Sept. 20-21 policy meeting, but the chairwoman hedged her comments in ways that give the central bank an out if economic data disappoint in the next few weeks.
Most important, the Fed’s decision appears to hinge on whether the Labor Department’s Sept. 2 jobs report shows steady gains in hiring. Job gains have averaged 190,000 a month over the past three months.
“Our decisions always depend on the degree to which incoming data continues to confirm the [Fed’s] outlook,” she said. If the Fed doesn’t move in September, it has two more meetings this year, one in November just before U.S. elections and another in December. Her comments suggest she expects a move at one of these meetings if the central bank doesn’t raise rates in September.
And Fischer doubled down on what Yellen said…
“I think what the Chair said today was consistent with answering yes to both of your questions, but these are not things we know until we see the data.”
“I think the evidence is the economy has strengthened… the big numbers are better than they have been for some time.”
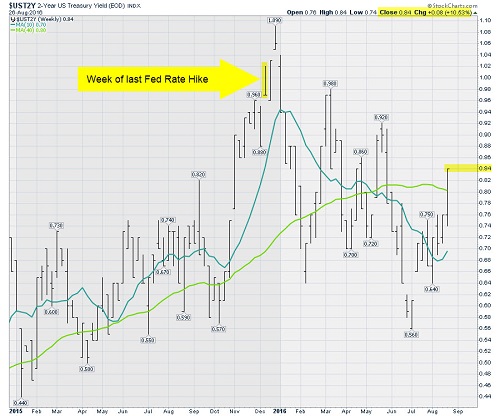
In looking back at the timing of the 2015 Fed Funds rate hike, here is a chart of the Two-Year Yield…
While it did snap higher on Friday, will it need to have a follow through move like in Nov/Dec 2015 before we get the next hike?
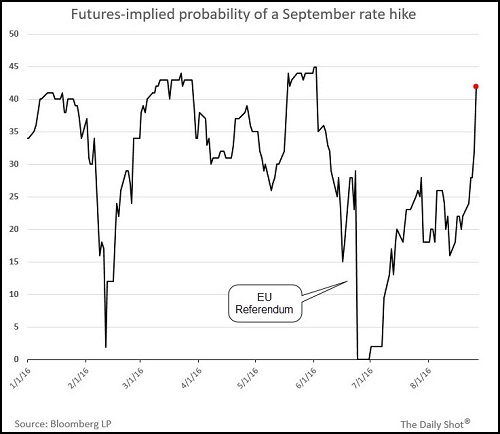
The markets pushed September’s Fed Funds rate hike probability to 42% on Friday…
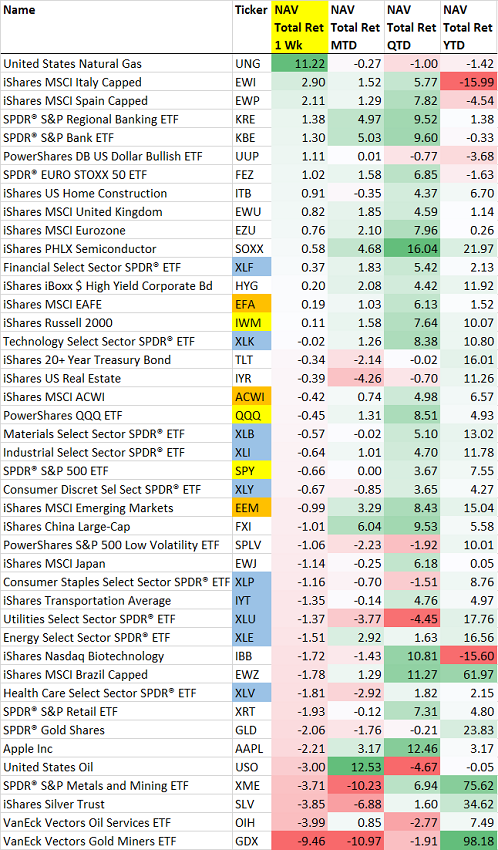
Looking at the week’s returns shows several interesting moves:
– Natural Gas >> Crude Oil
– Italy/Spain > Europe > EFA > EEM
– U.S. Dollar +1%
– Banks > XLF which leads all XL Sectors
– Semis > Nasdaq100
– Junk Bonds > Risk Free U.S. Treasuries
– Small Caps > Large Caps
– Utes, Staples, REITs lag as high dividend payers see further selling
– EpiPen takes down Healthcare and Biotech
– XRT -2% on a difficult week for Retailer earnings (save Best Buy & Tiffany’s)
– Oil, Precious Metals and any stock touching either was the worst place to be (blame the Fed & US$?)
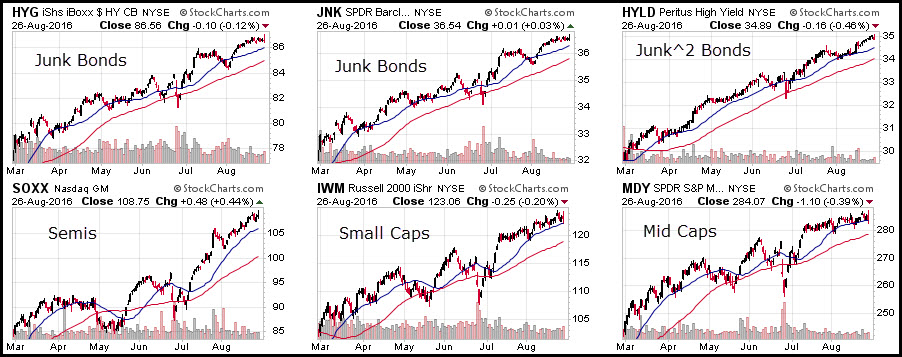
Sectors/assets holding their trends the best:
Sectors which continue to give their investors butterflies…

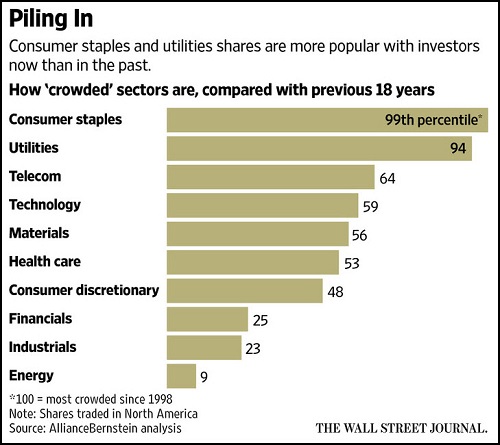
Tough for the equity income proxies to outperform when everyone owns them…
Two of the most crowded sectors right now are consumer staples and utilities, according to analysis by Vadim Zlotnikov, a co-head of multi-asset solutions and chief market strategist at AllianceBernstein LP. Such stocks have been popular this year because their regular dividend payouts make them attractive as income-bearing substitutes for bonds. Utilities are the second-best-performing sector of the S&P 500 so far in 2016, rising 15%.
Mr. Zlotnikov’s analysis ranks North American-traded utilities stocks in the 94th percentile in terms of how “crowded” they are as of mid-August compared with the past 18 years. Consumer-staples companies are in the 99th percentile. Energy stocks, which are up nearly as much as utilities so far this year in the S&P 500, are in the 9th percentile.
Overwhelmingly popular, or “crowded,” trades in recent years have tended to provide some outperformance on the way up, but lose all those gains and more in the subsequent drawdowns, according to the analysis.
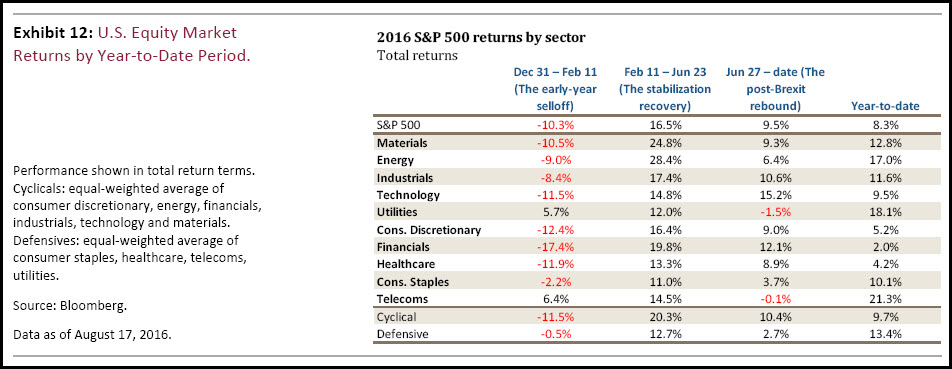
As U.S. Trust shows below, it is the Cyclical groups which have put up some of the best performance since February…
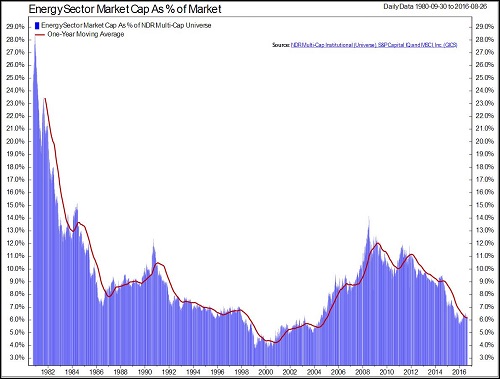
As the Energy sector tries to stabilize this year, here is a good look at its importance to the S&P 500…
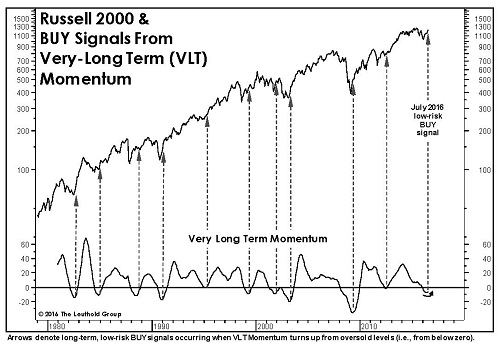
The recent outperformance in U.S. Small Caps is giving the team at Leuthold a valuable Very Long-Term Momentum BUY signal…
@LeutholdGroup: #SmallCap positive: VLT #Momentum issued a $RUT BUY. While it’s a short history, since 1979 only one signal failed.
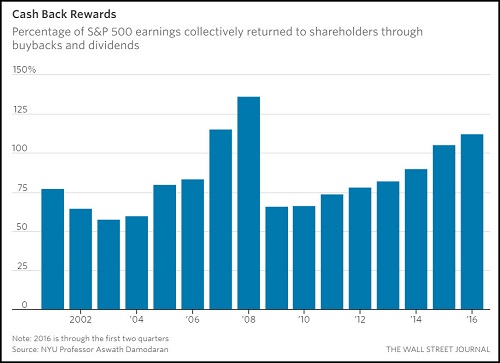
If you need a new Short strategy, try developing one that shorts those companies cutting dividends and stock repos which are heavily owned by the indexes…
Mr. Damodaran, who likes to be provocative, says with rates this low, traditional valuation metrics are distorted. Instead, the inability of companies to keep paying off their investors will cause the next downturn. “This is the weakest link in this market,” Mr. Damodaran said in an interview. “We know cash flows will go down. What we don’t know is what the market is pricing in.”
Meanwhile, S&P 500 companies have logged four consecutive quarters of shrinking profits and tepid sales. That could force companies to buy less of their own stock and would take away a pillar of support for this market.
With earnings growth expected to be tepid in the coming quarters, maintaining dividends and repurchasing stock will only become more difficult. That trend might have already started. By one estimate, the value of stock-buyback announcements in the second quarter slowed to its lowest level in four years.
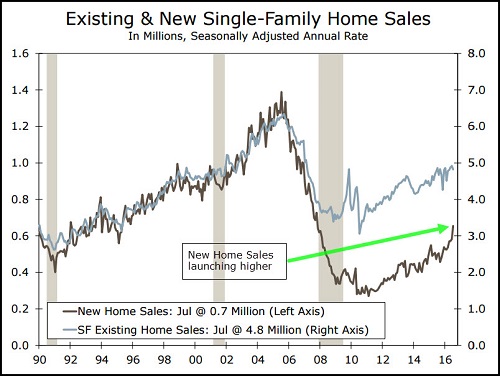
Economic data worth highlighting last week was New Home Sales which crushed it…
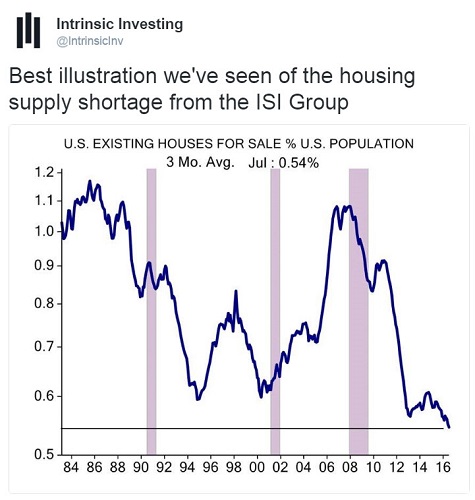
Existing home sales posted a less impressive number but this is likely impacted by the low inventory and rising prices of the existing base.
ISI Group has the inventory chart that you were just thinking about…
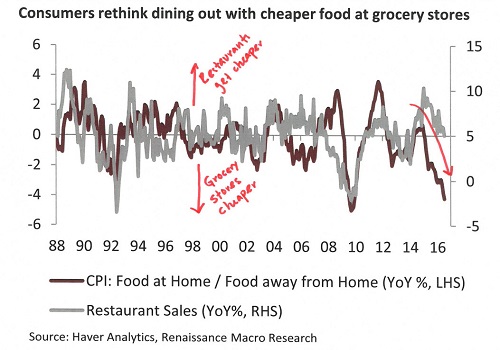
Rising restaurant wages, employee healthcare costs & real estate rents making eating at home much cheaper than eating out…
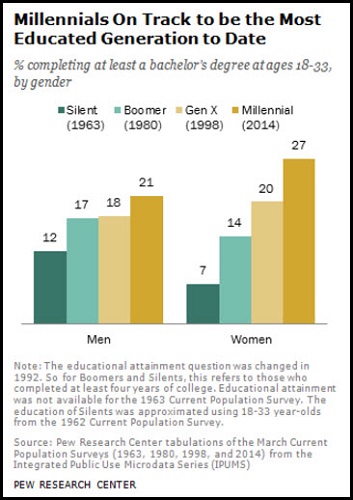
“Remember back when Men had higher salaries than Women?”
A soon to be future question given this chart…
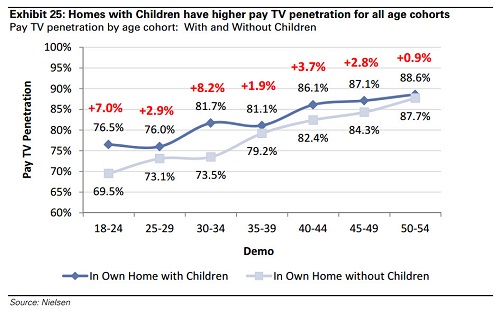
Cable and satellite companies might be forced to develop an “always on screensaver” of the Barry White music library…
Disclaimer: The information presented here is for informational purposes only, and this document is not to be construed as an offer to sell, or the solicitation of an offer to buy, securities. Some investments are not suitable for all investors, and there can be no assurance that any investment strategy will be successful. The hyperlinks included in this message provide direct access to other Internet resources, including Web sites. While we believe this information to be from reliable sources, 361 Capital is not responsible for the accuracy or content of information contained in these sites. Although we make every effort to ensure these links are accurate, up to date and relevant, we cannot take responsibility for pages maintained by external providers. The views expressed by these external providers on their own Web pages or on external sites they link to are not necessarily those of 361 Capital.

