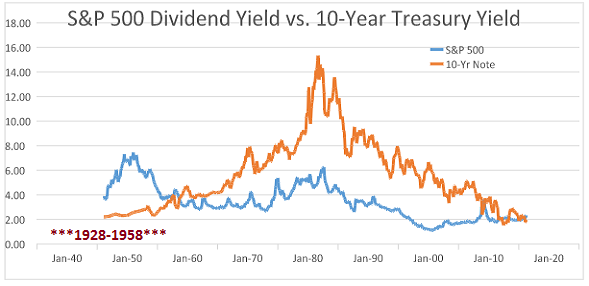
One argument in favor of buying U.S. stocks regardless of traditional valuation extremes? The S&P 500 SPDR Trust (NYSE:SPY) offers an annual dividend yield (2.06%) that is significantly higher than a 10-year Treasury bond (1.71%).
Unfortunately, risk assets do not morph into risk-free assets when the former yields more than comparable treasuries. On the contrary. Some of the worst bear markets in history occurred when the dividend yield for U.S. stocks was higher than the 10-year yield; meanwhile, some of the strongest bull markets occurred when the dividend yield for U.S. stocks was much lower than that of comparable 10-year treasuries.
For example, U.S. stocks served up juicier dividend percentages than 10-year treasuries for roughly three decades between 1928 and 1958. A competing asset approach, then, would have failed the investor who loaded up on equities prior to bears in 1929-1932 (-86%), 1937-1938 (-49%), 1938-1939 (-23%), 1939-1942 (-40%), 1946-1947 (-23%) and 1956-1957 (-22%).
What about when comparable government bonds are yielding more than U.S. stocks? Does this circumstance make sovereign debt more attractive than equities? Not necessarily. Consider the 25-year period of rising interest rates between 1957 and 1982. For one thing, steadily rising rates eroded total returns for sovereign debt in the period. In addition, investors might have found themselves under-allocated to stocks during a number of powerful bulls, including 1957-1961 (86%), 1962-1966 (80%), 1966-1968 (48%), 1970-1973 (74%) and 1974-1980 (126%).
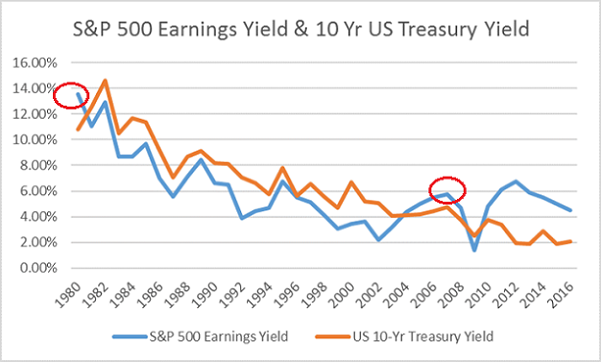
Another comparison that many are making today to justify adding stocks involves the earnings yield – the S&P 500’s earnings per share divided by the S&P 500 ‘s price. If the earnings yield is higher than the 10-year’s yield, some take this as a sign that stocks are undervalued. Right now, in fact, the earnings yield of 4.1% ($86.5 GAAP/2112) is much greater than the 10-year’s 1.7%.
Regrettably, this methodology failed those who purchased stocks in 1980 before the 11/1980-8/1982 bear mauling (-27%). Worse yet, it completely misled investors prior to the financial crisis between 10/2007 and 3/2009 (-57%).
It gets worse. If the earnings yield for the S&P 500 is lower than the 10-year Treasury yield, this model deems stocks to be overvalued relative to sovereign debt. The chart above further illustrates the folly. Not only would an investor have been encouraged to buy in 1980 before the 80-82 bear – not only would he/she have made a similar mistake prior the financial collapse ahead of the 2007-2009 bear – he/she would have been discouraged from adding stock exposure in one of the best secular bulls ever. From December of 1982 through August of 1987, stocks rocketed 229%; they catapulted 582% between 12/1987 and 3/2000.
The competing asset argument – the notion that there is no alternative other than stocks because cash and bonds yield very little – is seriously flawed. Purchasing stocks over bonds due to higher dividend yields and/or higher earnings yields ignores one of the most basic concepts of them all: risk of loss.
Obviously, when central banks encourage speculative behavior through the manipulation of interest rates, investors will bid riskier assets up to extraordinary levels. On the other hand, neither the Federal Reserve nor other central banks across the globe can permanently arrest the development of economic weakness. In spite of ultra-low borrowing costs (or maybe because of it), corporations may still spend less. Consumers may still spend less. Jobs may still be difficult to come by.
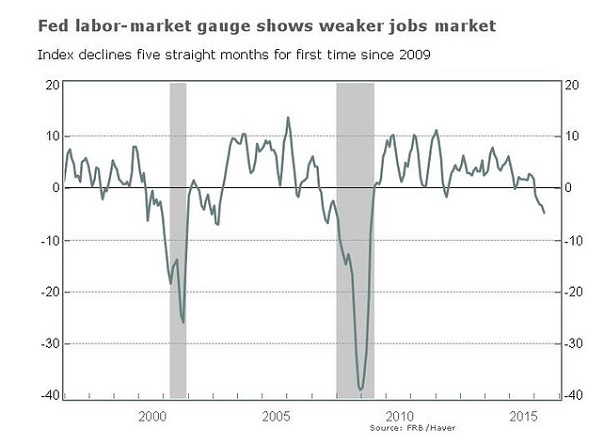
Consider the Federal Reserve’s own Labor Market Conditions Index (LMCI). The LMCI tracks 19 distinct aspects of employment well-being and the indicator has contracted for five consecutive months. (And you thought the May payrolls report was an anomaly.)
The LMCI rolled over prior to the tech wreck in 2000 and the financial crisis in 2008. Is this time going to be different? Maybe. However, ongoing deterioration in the global economy as well as the domestic economy does not typically spark an increase in risk taking.
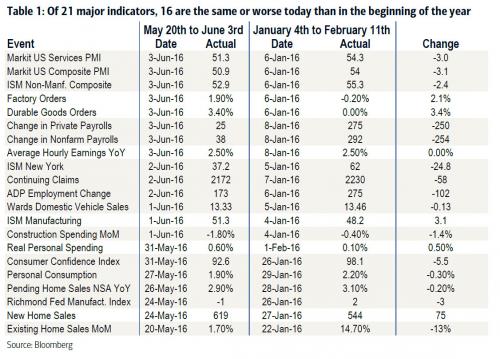
Bear in mind, the World Bank just slashed its estimates for global growth in 2016 from 2.9% (January’s forecast) to 2.4%. The agency downgraded U.S. economic output for the year to an exceptionally tepid 1.9%. What’s more, since the beginning of 2016, the U.S. economy has stagnated or deteriorated across 16 of the 21 most widely followed gauges of economic health.
Here’s the bottom line. You can kid yourself about the benefits of taking on more stock exposure as long as the S&P 500’s earnings yield or dividend yield is higher than the 10-year Treasury. Or you can recognize that economic feebleness tends to engender risk aversion.


