About three weeks ago, I wrote that stock prices appeared to be extended and due for a pause (see Time for a market pause? and A time for caution). I had expected a brief and shallow correction, but that equity prices would remain in an uptrend and we should expect a Santa Claus rally late in the year.
I was wrong on the correction. The overbought condition in the stock market resolved itself in a sideways consolidation. Moreover, the consolidation period seems to be over as several major US equities rallied to all-time highs last week.
Reasons to be bullish
There are multiple reasons for my inner trader to get more bullish on stocks. First of all, the excessive bullishness seems to have retreated, which is supportive of further new highs. The AAII sentiment readings, which can be volatile, show that bullishness has fallen while bearishness has risen (via Bespoke):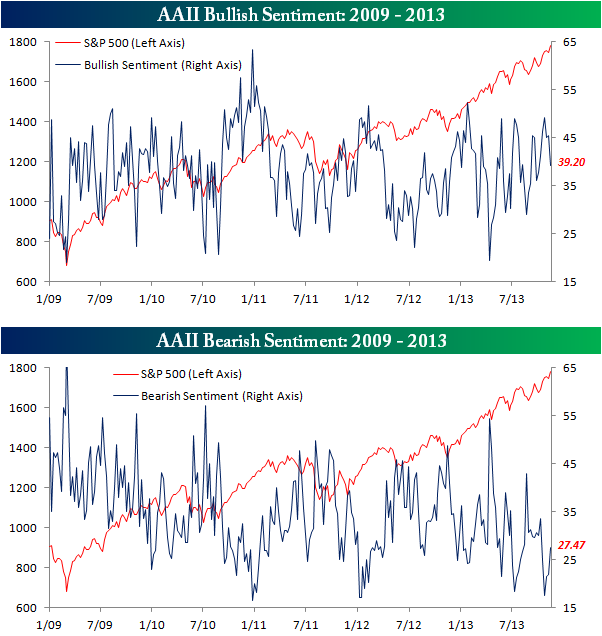
As well, Arthur Hill at ChartWatchers pointed out that market breadth is improving and confirming the current advance in stock prices.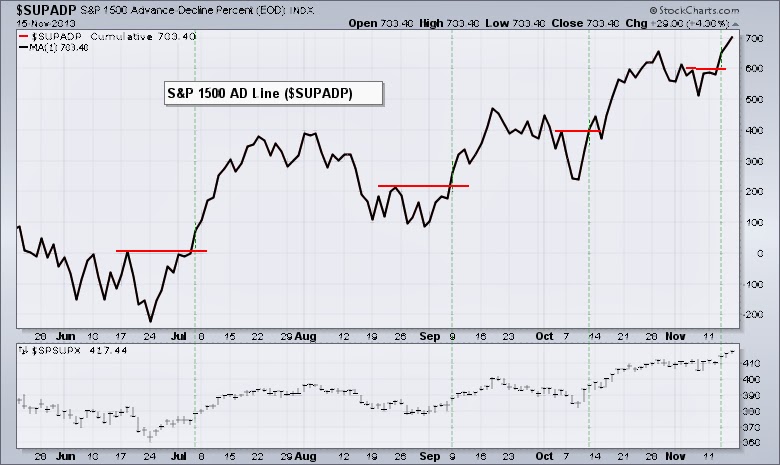
What's more, George Soros has significantly reduced his SPX put position which suggests that the position was a hedge and not a directional bet on the market.
Cyclical strength continues
I am also seeing signs of continued cyclical strength. Earnings Season has come and gone and the result can be best described as "Meh!" In the meantime, the American economy continues to muddle through. What is particularly constructive for the intermediate term economic outlook is the positive relative performance exhibited by cyclical stocks: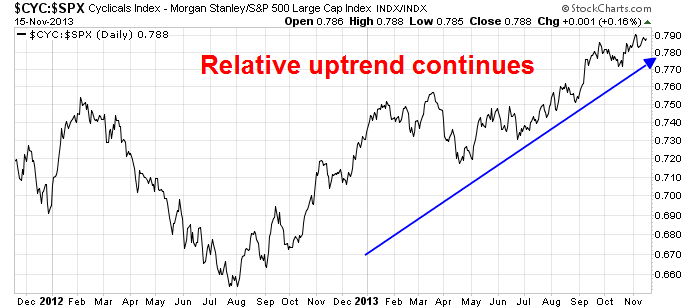
In particular, we can see that kind of relative performance behavior in the Consumer Discretionary sector: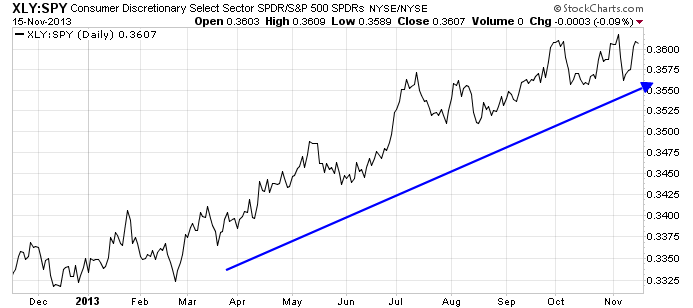
..and the capital goods sensitive Industrial sector: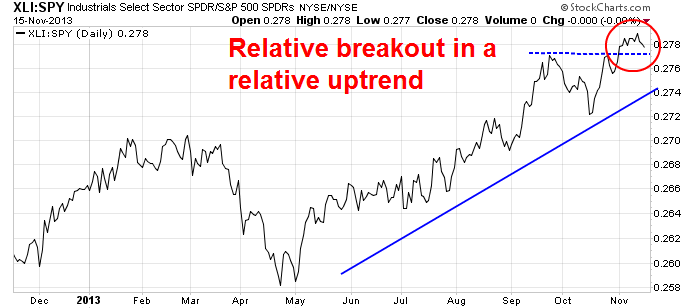
Broker-Dealers strengthening
One important "tell" of market direction has been the relative performance of the Broker-Dealers, which has rallied through relative resistance and remains in a shallow relative uptrend against the market: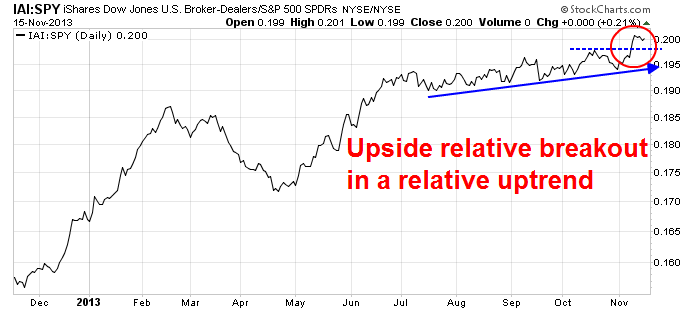
The relative performance of the Broker-Dealers is important because of their *ahem* ability to extract extraordinary profits from the market. The #AskJPM event was a poster child of the manifestation of this "ability". Here are a few of my favorite questions from that event:
Junk bonds as a measure of risk appetite
J.C. Parets wrote last week that we should watch the junk bond market, citing a post from stockcharts.com, largely because junk bond prices have been highly correlated with stock prices.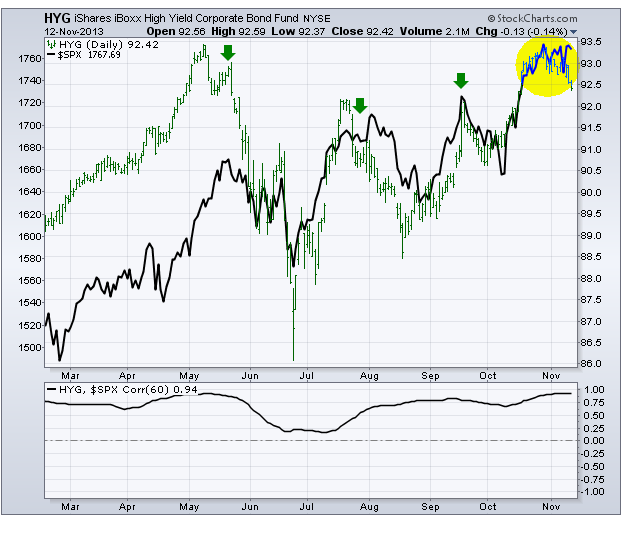
I would add that the performance of junk bonds are a reflection of risk appetite. This chart, of the relative performance of junk bonds via the iShares iBoxx USD High Yield Corporate Bond ETF (HYG) relative to 7-10 Treasuries via the iShares Barclays 7-10 Year Treasury Bond ETF, (IEF) indicate a relative uptrend and therefore rising risk appetite: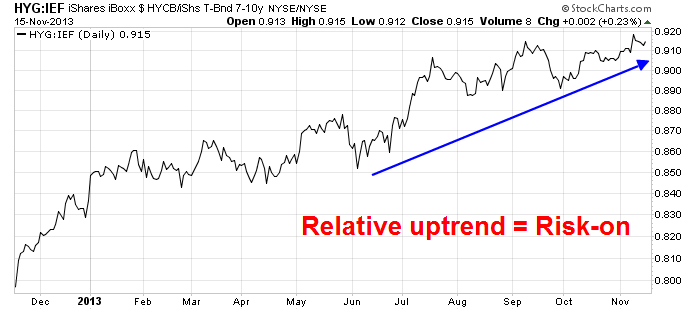
What to watch for
To be sure, the bulls don't necessarily have clear sailing ahead. I am watching a trio of Risk-On/Risk-Off indicators for signs that stock prices are ready to roar ahead into a Santa Claus rally. These indicators consist of:
- The Consumer Discretionary/Consumer Staples pair, measured by XLY/XLP as an indicator of the cyclical strength of the American consumer (shown in black in the chart below);
- The Sotheby's/Wal-Mart pair, as a measure of the champagne/beer trade (in orange); and
- The small cap/large cap pair, as a measure of risk appetite (in green).
All three pairs rolled over in early October, but the XLY/XLP has ticked up in the last week indicating a return of cyclical strength.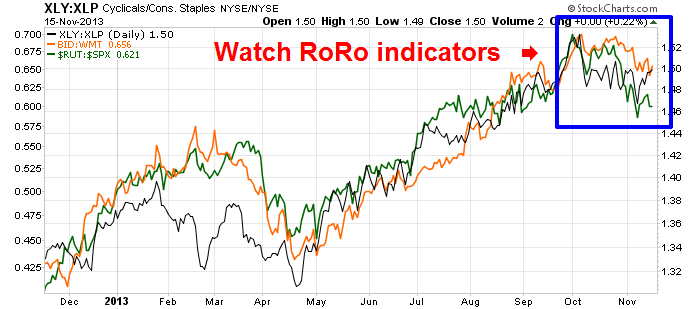
As the US calendar heads into Thanksgiving and the Black Friday kick-off of the year-end shopping season, I am also watching carefully the behavior of retailing stocks for an indication of consumer strength. Retailing stocks remain range-bound relative to the stock market and it will be interesting to see which way it breaks out: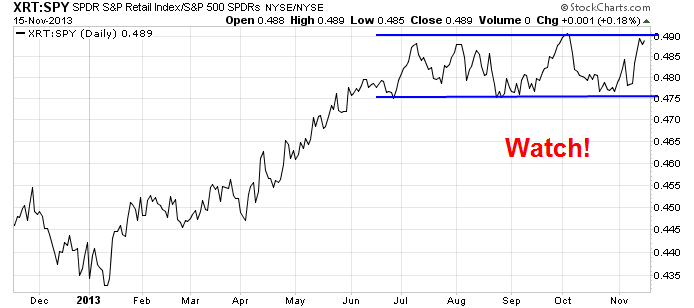
Bottom line: My inner trader is cautiously bullish on market direction, but risks remain. If you get long, it's important to define your risk parameters and maintain a stop-loss discipline.
Disclosure: Cam Hui is a portfolio manager at Qwest Investment Fund Management Ltd. (“Qwest”). The opinions and any recommendations expressed in the blog are those of the author and do not reflect the opinions and recommendations of Qwest. Qwest reviews Mr. Hui’s blog to ensure it is connected with Mr. Hui’s obligation to deal fairly, honestly and in good faith with the blog’s readers.”
None of the information or opinions expressed in this blog constitutes a solicitation for the purchase or sale of any security or other instrument. Nothing in this blog constitutes investment advice and any recommendations that may be contained herein have not been based upon a consideration of the investment objectives, financial situation or particular needs of any specific recipient. Any purchase or sale activity in any securities or other instrument should be based upon your own analysis and conclusions. Past performance is not indicative of future results. Either Qwest or I may hold or control long or short positions in the securities or instruments mentioned.
