A shockingly low US Non-Farm Employment Change result of only 38K sent USD pairs scrambling in its wake last Friday. Notably, the Swissy was hit exceptionally hard and sunk to 0.9751 by the end of the trading week. However, the pair continued to falter during the Monday session which brings into question just how low the USD/CHF can plummet. As a result of a combination of technical indicators, the poor US Non-Farm Employment Change figure could have simply been the push the pair needed to plunge back to recent lows.
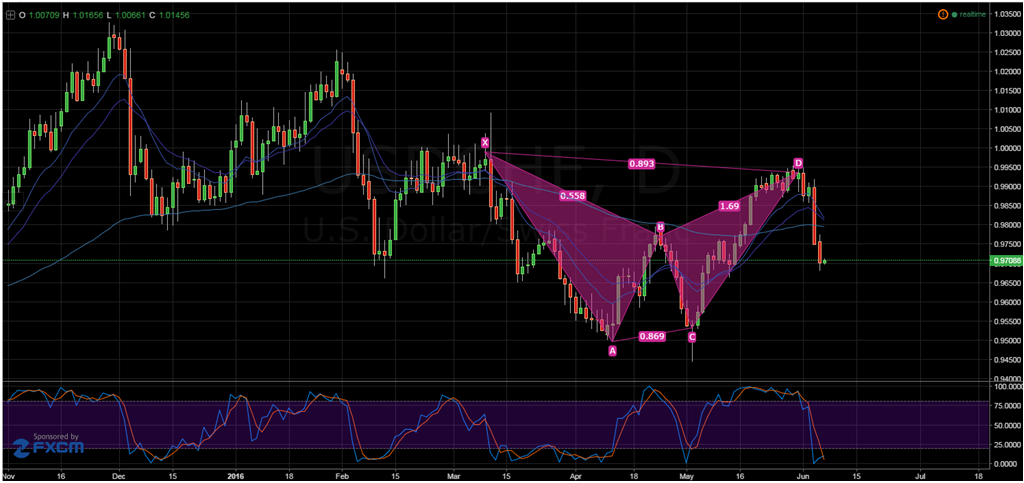
Firstly, whilst the 38K US Non-Farm Employment Change result is largely to blame for the recent reversal, a bearish bat pattern has been signalling an underlying weakness for some time. Consequently, the anaemic Jobs data provided the spark needed to set off the Swissy and send it reeling. However, the pair might not be done falling just yet as technical indicators are still in agreement that the USD/CHF could have additional downside potential.

As shown on the daily chart, EMA activity is becoming highly bearish which could spell extended losses for this pair. Specifically, the imminent intersection of the 12 and 20 day EMA’s are hinting that the USD/CHF has fully reversed the recent trend. Additionally, the two shorter EMA’s are on the verge of crossing over with the 100 day EMA which could see the pair become bearish in the long-term.
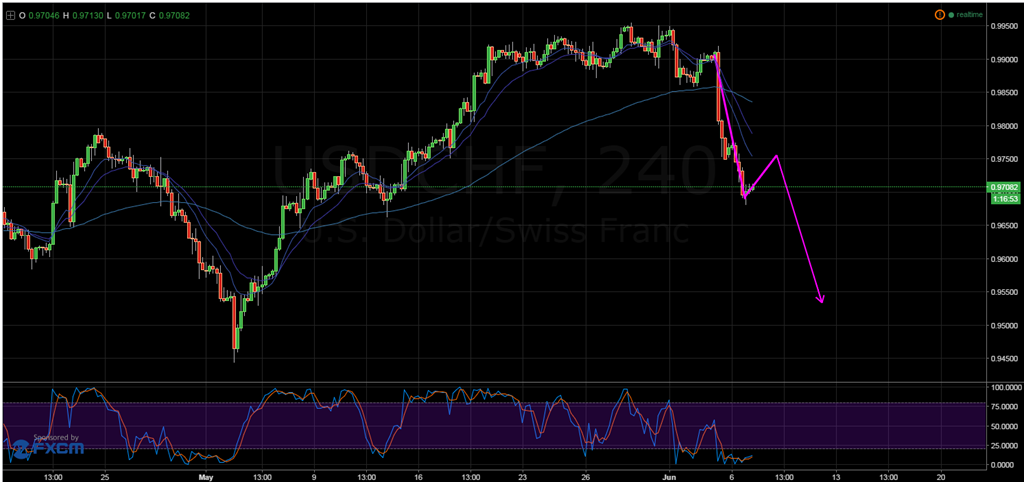
Taking a look at the H4 chart, it is clear that the recent downturn could be the first leg of a corrective wave pattern. Consequently, there is likely to be a retracement in the form of a B leg before another plunge results during the C leg. Additionally, the highly oversold daily and H4 oscillator’s readings are providing support which should ensure that his retracement takes place.

It is expected that the B leg finds resistance around the 0.9753 mark before beginning the final C leg in the corrective wave. Once this final leg begins, it will likely extend to the long term zone of support around 0.9528 before running out of momentum entirely. As a result, keep a close eye on fundamental indicator releases as the pair retraces over the next number of sessions. Another weak US result could provide the requisite push needed to send the USD/CHF tumbling once again.
Ultimately, sentiment towards the USD has proved to be erratic over the past few weeks as a result of the hawkish Fed rhetoric. However, the technicals are in agreement that this pair could be destined to be bearish for some time yet. Specifically, the presence of various chart patterns and the recent EMA activity are providing some fairly compelling reasons to doubt the upside potential of the Swissy. As a result, keep a close watch on this pair especially as the Fed rate decision draws nearer.
