E&P companies have added 30 horizontal rigs in the Permian basin since the end of June. Most analysts didn’t notice (Figure1).
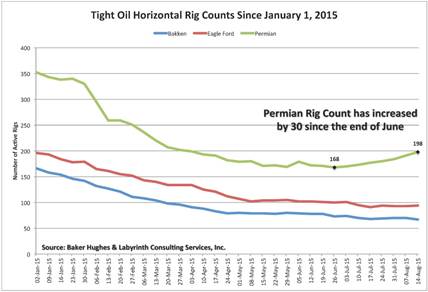
Figure 1. Tight oil horizontal rig counts since January 1, 2015.
Source: Baker Hughes (NYSE:BHI) & Labyrinth Consulting Services, Inc.
(click image to enlarge)
Rig counts in most active plays are stabilizing after falling more than 50% since November but companies are adding rigs in the Permian like there’s a boom going on. Last week the total U.S. rig count was unchanged but 7 new horizontal rigs were added in the Permian. In fact, rigs were added in each of the last 7 weeks there.
There have been a lot of silly pronouncements since oil prices collapsed about how rig counts don’t matter anymore. Pad drilling and extraterrestrial advances in rig efficiency have made rig counts a meaningless measure. Also, the backlog of deferred completions allow companies to add production without adding new rigs. So we are told. But rig counts matter because they show where capital is going. When a rig contract is signed, major cash follows and usually, for a long period of time.
When capital in the oil business is scarce, a counter-flow of 30 new rigs into one play says a great deal about how company executives view that play. 30 new rigs in the Permian basin means more than $200 million in capital expenditures if all the rigs are released after drilling just one well and no further spending occurs as a result of the drilling.
Since rig counts began falling in November 2014, there have always been more rigs in the Permian than in any other tight oil or shale gas play (Figure 2).
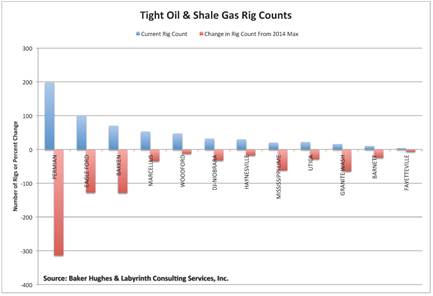
Figure 2. Tight oil and shale gas rig counts as of August 14, 2015. Source: Baker Hughes & Labyrinth Consulting Services, Inc.
(click image to enlarge)
More rigs have also been released in that play than in any other. Still, there are more than twice as many rigs drilling in the Permian as there are in the Eagle Ford Shale, and almost three times as many as there are in the Bakken play.
Rig count is how company executives vote on the plays.
We may hear great things about the potential of the Utica Shale but it’s in the lower third for rigs and, therefore, capital. Studies proclaim that the Barnett and Fayetteville core areas are commercial at current gas prices but almost no one wants to put rigs there and spend money. Even the mighty Marcellus is a distant fourth in rig count behind the Permian, Eagle Ford and Bakken.
There is a reason and it is profit or the perception of profit and rig count is how we know the score.
For plays like the Eagle Ford and the Bakken, the best leases were taken long ago. If you don’t have a position, the only way to get one is to buy or join someone else at a premium (e.g., Devon and Encana in the Eagle Ford).
But the Permian is different. It is an old producing basin whose glory days were decades ago until tight oil technology came along. As a result, the land situation is complex and fragmented and there is usually a way to get in on a lease or a play with a good landman and enough money.
There are multiple pay horizons in the Permian whereas, in the Eagle Ford and Bakken there is basically only one pay zone. In a comprehensive study done in 2000, Shirley Dutton of the Bureau of Economic Geology identified 32 different oil plays from 1,339 significant reservoirs in the Permian basin and each reservoir with cumulative production greater than 1 million barrels of oil.
The Bakken and Eagle Ford are dominated by a dozen or so substantial public companies but in the Permian, there are hundreds of operators, many of whom are small and privately held, and some that are without access to the major capital required to be a shale player. To put it bluntly, the Permian is a great place for tight oil have-nots to find a home. Deals can be made in the Permian.
How Good Is the Permian Basin Anyway?
EOG Resources (NYSE:EOG) and Pioneer Natural Resources Company (NYSE:PXD) have strong positions in the Permian basin, Eagle Ford Shale and other shale plays. Their CEOs have very different views on how good the Permian basin is.
EOG CEO Bill Thomas spoke in May 2014 at the Sanford C. Bernstein Strategic Decisions Conference about the Permian basin:
“…the Permian is a great place to drill wells… But it’s not the play quality, the rock quality and the technical aspects of the play are not nearly as strong as Eagle Ford or the Bakken. And it will not be able to maintain this dramatic growth rate that we have had historically in the country. And it will not be able to replace an Eagle Ford or a Bakken.”
Related: More Rotten News For The Commodities Markets
Pioneer CEO Scott Sheffield spoke about the Permian basin in August 2013 at the Unconventional Resources Technology Conference (URTeC) in Denver:
“The Spraberry Wolfcamp could possibly become the largest oil and gas discovery in the world.”
So, how good is the Permian, anyway?
The horizontal plays in the Permian basin are not shale plays. They are purely conventional sandstone reservoirs that were discovered decades ago and are now being exploited using horizontal drilling and hydraulic fracturing.
The recent rig additions in the Permian basin are directed chiefly at the Trend Area and Bone Spring plays (Figure 3).
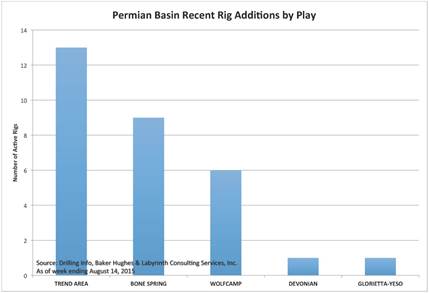
Figure 3. Permian basin recent rig additions by play for the 6 weeks ending August 14, 2015.
Source: Drilling Info., Baker Hughes & Labyrinth Consulting Services, Inc.
(click image to enlarge)
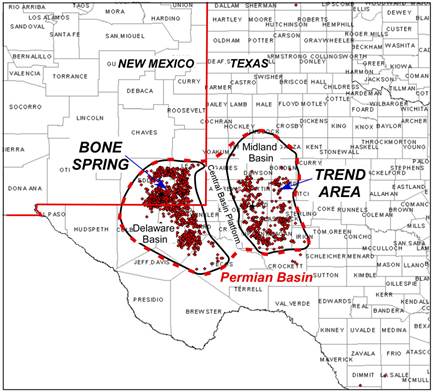
The Trend Area is located in the eastern Midland sub-basin of the greater Permian basin, and the Bone Spring play is located in the western Delaware sub-basin (Figure 4).
Figure 4. Permian basin location map showing Delaware and Midland sub-basins and the locations of the Trend Area and Bone Spring plays. Source: Drilling Info, Murchison Oil & Gas, Inc. and Labyrinth Consulting Services, Inc.
(click image to enlarge)
I studied the Bone Spring and Trend Area plays by evaluating well performance for the major operators in each play. I used standard decline-curve analysis to determine estimated ultimate recovery (EUR) by operator for wells with first production in 2012, 2013 and 2014.
My analysis suggests that Bill Thomas has the more accurate assessment of the Permian basin based on reserves and economics for these two leading plays. In other words, it’s not as good as the Eagle Ford or Bakken but it’s a pretty good place to have a position for when oil prices are higher.
The average well EUR for the major operators in the Bone Spring play is 205,000 barrels of oil equivalent (boe) and, in the Trend Area, 140,000 boe. Costs are comparable to the Eagle Ford Shale and there, the break-even EUR is 350,000 boe at $70/barrel WTI oil price (full-cost economics but not including land). The difference is that, in the Eagle Ford, there are significant areas with EUR greater than 350,000 boe. Fewer than 1% of Bone Spring wells and no Trend Area wells meet this criterion.
Related: A Key Tool For Energy Investors
Bone Spring Evaluation
In the Bone Spring play, I evaluated wells by Concho, Devon, Cimarex, EOG, Mewbourne and Yates. Results are summarized in Table 1.
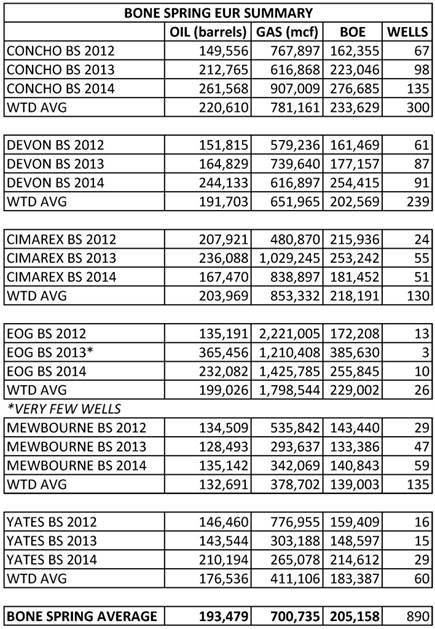
Table 1. Bone Spring EUR (estimated ultimate recovery) summary table showing oil, gas and barrels
of oil equivalent (boe) and weighted (WTD) averages based on the number of producing wells with
first production in 2012, 2013 and 2014. BS=Bone Springs.
Source: Labyrinth Consulting Services, Inc. with production data from Drilling Info.
(click image to enlarge)
Concho had the best average well performance followed closely by EOG, and Yates had the worst. Overall, well performance was fairly consistent among the various operators with weighted average EUR only varying 12% above and below the mean by the highest and lowest performing company.
Average well performance improved about 40% in 2014 compared to 2012 and, for Concho, Devon and EOG, average well performance improved by about 70%.
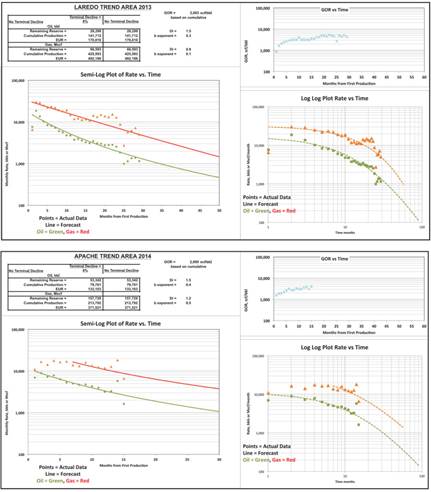
The decline-curve trend matches were generally excellent for the Bone Springs (Figure 5) providing a high level of confidence in the EUR values shown in Table 1.
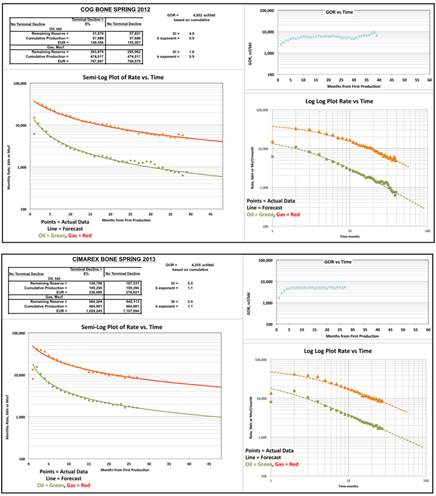
Figure 5. Examples of Bone Spring decline-curve analysis showing group decline for Concho (COG) wells
with first production in 2012 and for Cimarex wells with first production in 2013.
Source: Labyrinth Consulting Services, Inc. with production data from Drilling Info.
(click image to enlarge)
Trend Area Evaluation
In the Trend Area play, I evaluated wells by Apache (NYSE:APA), Energen, Encana, Laredo, and Pioneer. Horizontal drilling in the Trend Area does not have as much history as in the Bone Springs so only 2013 and 2014 data were available to evaluate and, for some operators, there was only 2014 data. Results are summarized in Table 2.
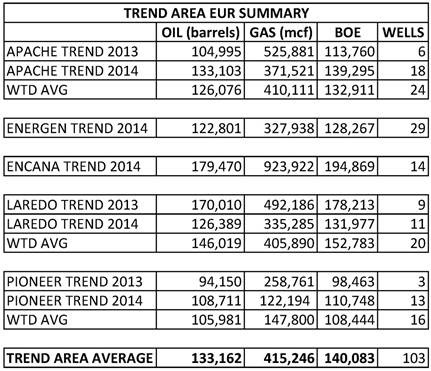
Table 2. Trend Area EUR (estimated ultimate recovery) summary table showing oil, gas and barrels
of oil equivalent (boe) and weighted (WTD) averages based on the number of producing wells with
first production in 2013 and 2014. Trend=Trend Area.
Source: Labyrinth Consulting Services, Inc. with production data from Drilling Info.
Encana had the best average well performance and Pioneer had the worst. Overall, well performance was less consistent for Trend Area operators than for Bone Spring operators with weighted average EUR varying about 25% above and below the mean by the highest and lowest performing company.
Related: Official: The U.S. Oil Export Ban Is (Sort Of) Over
Apache’s average well performance improved about 27% in 2014 compared to 2013, and Pioneer’s wells improved 15%. Laredo’s average well performance decreased by 26%.
The decline-curve trend matches were generally fair for the Trend Area, as shown in Figure 6, providing only a moderate level of confidence in the EUR values shown in Table 2.
Figure 6 Examples of Trend Area decline-curve analysis showing group decline for Laredo wells
with first production in 2012 and for Apache wells with first production in 2013.
Source: Labyrinth Consulting Services, Inc. with production data from Drilling Info.
(click image to enlarge)
“The best places to find oil are in places where it’s already been found.”
Simmons & Company International recently published average well EUR for the Bone Spring play as 676 boe. If you believe that number, there is no mystery about why companies are adding rigs in the Permian. Let’s assume for now that I am closer to the truth than Simmons (they don’t explain the source of that EUR).
Neither the Bone Springs nor the Trend Area are commercial unless oil prices return to $100 per barrel using full-cost economics. Even using phony shale half-cycle economics, prices have to be much higher than anyone’s forecast for the next several years.
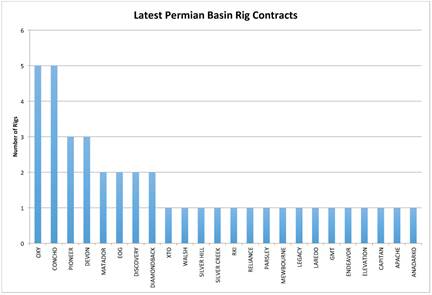
Here are the players who have contracted rigs in the last few months:
Figure 7. Latest Permian basin rig contracts. Source: Drilling Info and Labyrinth Consulting Services, Inc.
(click image to enlarge)
Most of the companies are relatively small independents whose sole business is the Permian basin. Many don’t have access to enough capital to compete in the real shale plays. Or maybe they were never really sold on shale, and are more comfortable with a good old-fashioned sandstone reservoir. But, if you’re selling a prospect that has horizontal drilling and hydraulic fracturing, it sounds enough like a shale play to attract some capital.
Of the larger independents, Oxy, Concho and Apache are Permian-focused companies. The others–Pioneer, Devon, EOG and XTO–are companies with relatively strong balance sheets and diverse unconventional portfolios that are able to bet on the future.
The Permian basin probably has the lowest risk of all the tight oil plays because its reservoirs are purely conventional and there are multiple stacked pay intervals all charged with oil because the basin’s petroleum system is among the best in the world.
The Permian basin has been a large-scale enhanced oil recovery (EOR) project since I began my career in the oil business almost 40 years ago. The basin is blessed with more than 1000 high quality reservoirs and cursed because most of them have limited lateral continuity. For all the oil that’s been found, there is an undrained reservoir volume a stone’s throw from wherever you are. Horizontal drilling may be the holy grail to unlock those tens of billions of barrels that are stranded in real reservoir rock and not in a source rock like shale.
Perhaps that is Scott Sheffield’s vision for the Permian basin.
If you’ve bet your company on unconventional plays and the plays are not economic today, there are really only two choices: go out of business or double down on the opportunities you have and hope that higher prices will save you. The Permian, where the reservoir is not shale, may end up being the best tight oil play out there for the long term.

