
After a tough start to the year, the tech-heavy Nasdaq Composite Index has again showed weakness on another bout of negative sentiments. This is especially true as the index shed 2.6% over the past one-month versus a decline of 0.1% for the S&P 500 and a gain of 0.1% for Dow Jones. With this, the Nasdaq is down 9% from its all-time high recorded last July. If it falls another 1% from here, the index will enter into the correction territory.
Inside the Steep Decline
The major culprit is the spate of weak earnings reports from tech heavyweights like International Business Machines ( (NYSE:IBM) ), Netflix ( (NASDAQ:NFLX) ), Alphabet ( (NASDAQ:GOOGL) ), Microsoft ( (NASDAQ:MSFT) ), Apple ( (NASDAQ:AAPL) ) and Twitter Inc. ( (NYSE:TWTR) ) that has created panic in the market, pushing the stocks down. Overall, the tech sector’s Q1 earnings performance has been disappointing.
As per the Zacks Earnings Trend, total earnings for 85.3% of the sector market cap are down 5.9% on 0.7% higher revenues compared with 4.8% growth in earnings and 4.5% revenue growth in Q4. Earnings and revenue surprises were also worse than Q4 and the past four-quarter average. Additionally, weakness in semiconductor stocks, lofty valuations and reduced expectations for interest rates hike continued to weigh on investors’ sentiments (read: ETFs that Won & Lost Post Fed Meet).
Apart from sector-specific issues, global fundamentals have also taken toll on the broad sector and are expected to continue to do so in the days ahead. This is especially true as the U.S. economy expanded at the slowest pace in two years in the first quarter due to weak consumer spending, sluggish business investments, and less exports. Further, fears of a global slowdown returned with weak factory activity data from China and downgraded growth expectations from Europe.
Being an economically sensitive sector, tech stocks generally pick up in an expanding economic cycle, which seems far from here. This indicates more pain for the sector in the near term and the Nasdaq ETF PowerShares QQQ ETF (QQQ).
QQQ in Focus
This is the most popular fund tracking the Nasdaq-100 Index, which measures the performance of the largest domestic and international non-financial companies listed on Nasdaq. Holding 108 stocks in its basket, the fund is concentrated on the top firm – Apple – at 10.3% while other firms hold less than 8% of assets (read: Tech ETFs in Trouble Post Rotten Q2 Apple Results).
Though information technology dominates the fund’s portfolio with 55.1% share, consumer discretionary and health care account for a double-digit exposure each. The product has AUM of $35.1 billion and trades in heavy volume of more than 36 million shares per day on average. It charges 20 bps in annual fees and has lost 4.2% over the past one month. The fund has a Zacks ETF Rank of 2 or Buy rating with a Medium risk outlook.
A Look at Technical Analysis
To get some more idea of the trend, we looked at the technical chart of QQQ:
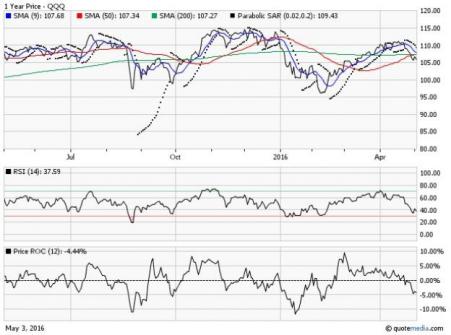
The chart pattern reflects a bear market for QQQ as per the 200-day simple moving average (SMA) indicator. This is because the fund broke its near-term and long-term trends to trade below the 200-Day SMA of $107.27. The 9-Day SMA is trending down and on track to meet the long-term SMA, indicating the bearish crossover (see: all the Technology ETFs here).
Additionally, the bearish trend is confirmed by the parabolic SAR, which is currently trading above the current price of the fund. The price momentum, as reflected by the price ROC, has also been negative at 4.44%, reflecting a downtrend. Further, the Relative Strength Index (RSI) is 37.59, indicating that the fund is slowly approaching the oversold territory.
NASDAQ-100 SHRS (QQQ): ETF Research Reports
INTL BUS MACH (IBM): Free Stock Analysis Report
NETFLIX INC (NFLX): Free Stock Analysis Report
ALPHABET INC-A (GOOGL): Free Stock Analysis Report
MICROSOFT CORP (MSFT): Free Stock Analysis Report
APPLE INC (AAPL): Free Stock Analysis Report
TWITTER INC (TWTR): Free Stock Analysis Report
Original post
Zacks Investment Research
- English (UK)
- English (India)
- English (Canada)
- English (Australia)
- English (South Africa)
- English (Philippines)
- English (Nigeria)
- Deutsch
- Español (España)
- Español (México)
- Français
- Italiano
- Nederlands
- Português (Portugal)
- Polski
- Português (Brasil)
- Русский
- Türkçe
- العربية
- Ελληνικά
- Svenska
- Suomi
- עברית
- 日本語
- 한국어
- 简体中文
- 繁體中文
- Bahasa Indonesia
- Bahasa Melayu
- ไทย
- Tiếng Việt
- हिंदी
Is The Nasdaq ETF (QQQ) Signaling More Trouble Ahead?
Published 05/03/2016, 10:15 PM
Updated 07/09/2023, 06:31 AM
Is The Nasdaq ETF (QQQ) Signaling More Trouble Ahead?
Latest comments
Install Our App
Risk Disclosure: Trading in financial instruments and/or cryptocurrencies involves high risks including the risk of losing some, or all, of your investment amount, and may not be suitable for all investors. Prices of cryptocurrencies are extremely volatile and may be affected by external factors such as financial, regulatory or political events. Trading on margin increases the financial risks.
Before deciding to trade in financial instrument or cryptocurrencies you should be fully informed of the risks and costs associated with trading the financial markets, carefully consider your investment objectives, level of experience, and risk appetite, and seek professional advice where needed.
Fusion Media would like to remind you that the data contained in this website is not necessarily real-time nor accurate. The data and prices on the website are not necessarily provided by any market or exchange, but may be provided by market makers, and so prices may not be accurate and may differ from the actual price at any given market, meaning prices are indicative and not appropriate for trading purposes. Fusion Media and any provider of the data contained in this website will not accept liability for any loss or damage as a result of your trading, or your reliance on the information contained within this website.
It is prohibited to use, store, reproduce, display, modify, transmit or distribute the data contained in this website without the explicit prior written permission of Fusion Media and/or the data provider. All intellectual property rights are reserved by the providers and/or the exchange providing the data contained in this website.
Fusion Media may be compensated by the advertisers that appear on the website, based on your interaction with the advertisements or advertisers.
© 2007-2024 - Fusion Media Limited. All Rights Reserved.