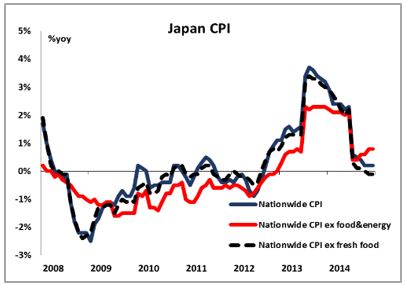
•Bank of Japan remains on hold. BoJ kept monetary policy unchanged as was widely expected, and said that the Japanese economy has “continued to recover moderately.” At the press conference afterwards, Gov. Kuroda maintained his upbeat view that the underlying trend of inflation is improving, despite the renewed fall in core CPI. He expects the CPI to reach 2% target around first half of 2016, but the timing may change depending on oil price. Gov. Kuroda also repeated that the monetary easing is having the intended effects and they will keep easing until the inflation target is stable. JPY gained on the news and fell below the psychological level of 120.00. Bank officials said recently that they see little need for an immediate expansion of monetary stimulus and would prefer to hold off to get a clearer picture of the economic outlook. Nevertheless, call for additional stimulus have been building up and the more important meeting will be the one at the end of the month, when new long-term projections for growth and inflation will be released in the semi-annual Outlook for Economic Activity and Prices report.
• Fed’s Williams affirms plans for 2015 rate hike San Francisco Fed President John Williams said that it still makes sense to raise rates this year. He also acknowledged that the pace of job growth is slowing, citing the weak September jobs report, but said that this is normal and even desirable at this point in the economic cycle. With the economy nearing full employment, Fed Williams expects to see job growth declining to that level and considers monthly gains of 140k to 170k making progress toward that goal. Even though the overall tone of the speech was positive, USD was weaker across the board. Odds of a rate hike this year have plunged following the weaker-than-expected September employment report on Friday. Fed funds futures point to March as the most likely month for a rate hike and the probability for a December move has fallen to 35%.
• Today’s highlights: During the European day, the German industrial production fell in August, a turnaround from the previous month. Even though the market reaction was limited at the release, this added to the recent soft data coming from the country. Norway’s industrial production for August is also coming out.
• In the UK, the construction PMI increased in August, but both the manufacturing and service-sector indices declined, driving the composite PMI lower. Industrial production is expected to rise in August, a turnaround from the month before, which could strengthen GBP. However, the disappointing PMI figures for August increase the likelihood for another slump. In such case, GBP is likely to come under renewed selling pressure.
• From Canada, we get the building permits for August.
• As for the speakers, San Francisco Fed President John Williams speaks again. He is a voting member of the Federal Open Market Committee this year and he reiterates his positive tone, USD could strengthen somewhat.
The Market
EUR/USD rebounds and breaks above 1.1200
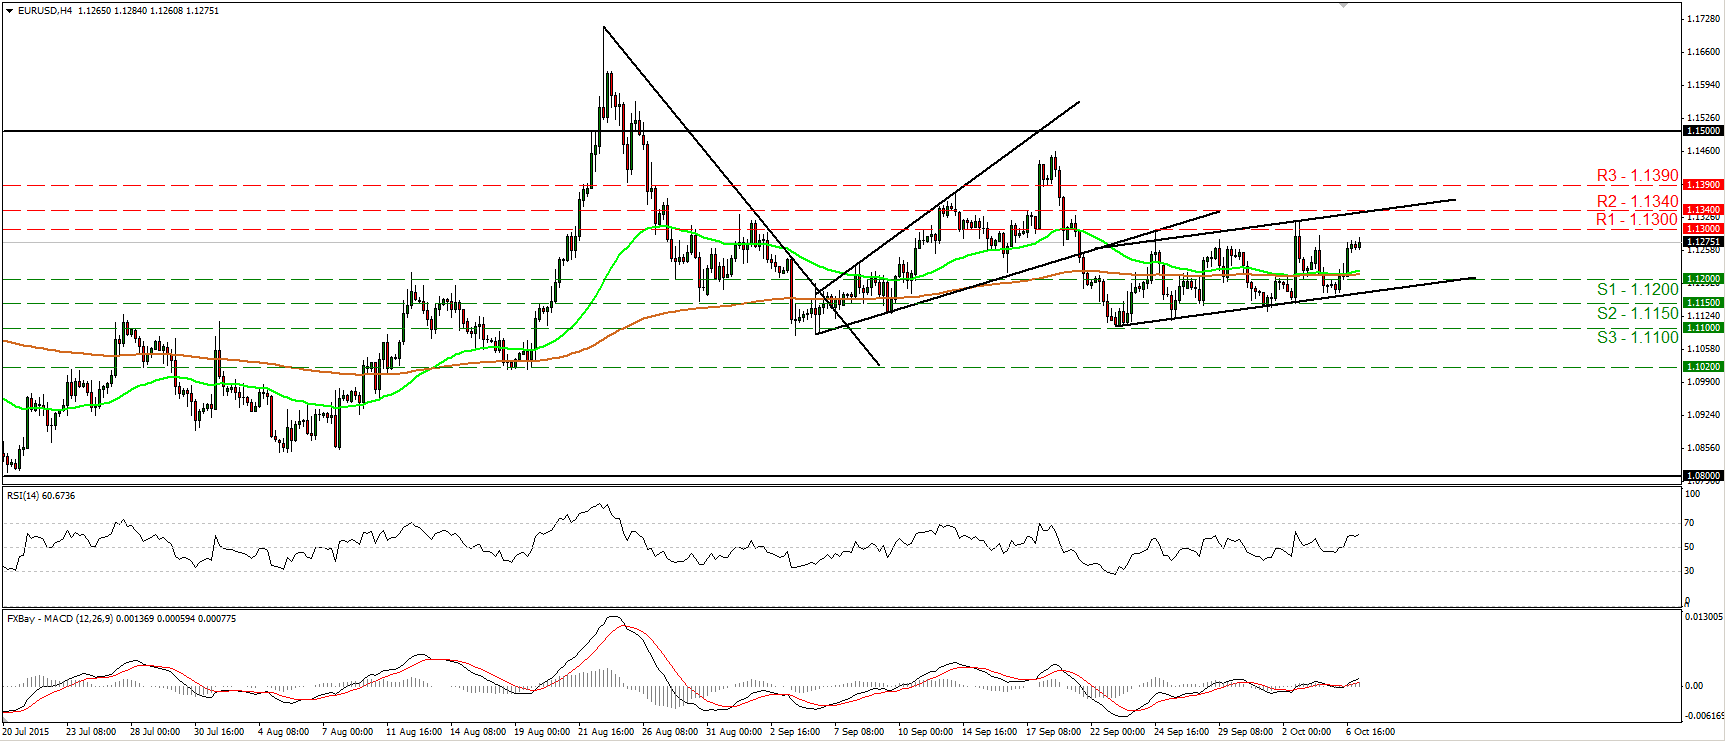
• EUR/USD traded higher on Tuesday, breaking above the resistance (now turned into support) barrier of 1.1200 (S1). Today, during the early European morning, the rate looks to be headed for another test at the 1.1300 (R1) line. A break above that line could aim for the next resistance at 1.1340 (R2). The RSI is back above 50 and now appears to be headed towards its 70 line, while the MACD stands above both its zero and trigger lines and points north. These indicators detect positive momentum and support that the rate could trade higher for a while. In the bigger picture, as long as EUR/USD is trading between the 1.0800 key support and the psychological zone of 1.1500, I would hold a flat stance as far as the overall picture is concerned. I would like to see another move above 1.1500 before assuming that the overall outlook is back positive. On the downside, a break below the 1.0800 hurdle is the move that could shift the picture negative.
• Support: 1.1200 (S1), 1.1150 (S2), 1.1100 (S3)
• Resistance: 1.1300 (R1), 1.1340 (R2), 1.1390 (R3)
EUR/GBP trades in a consolidative manner
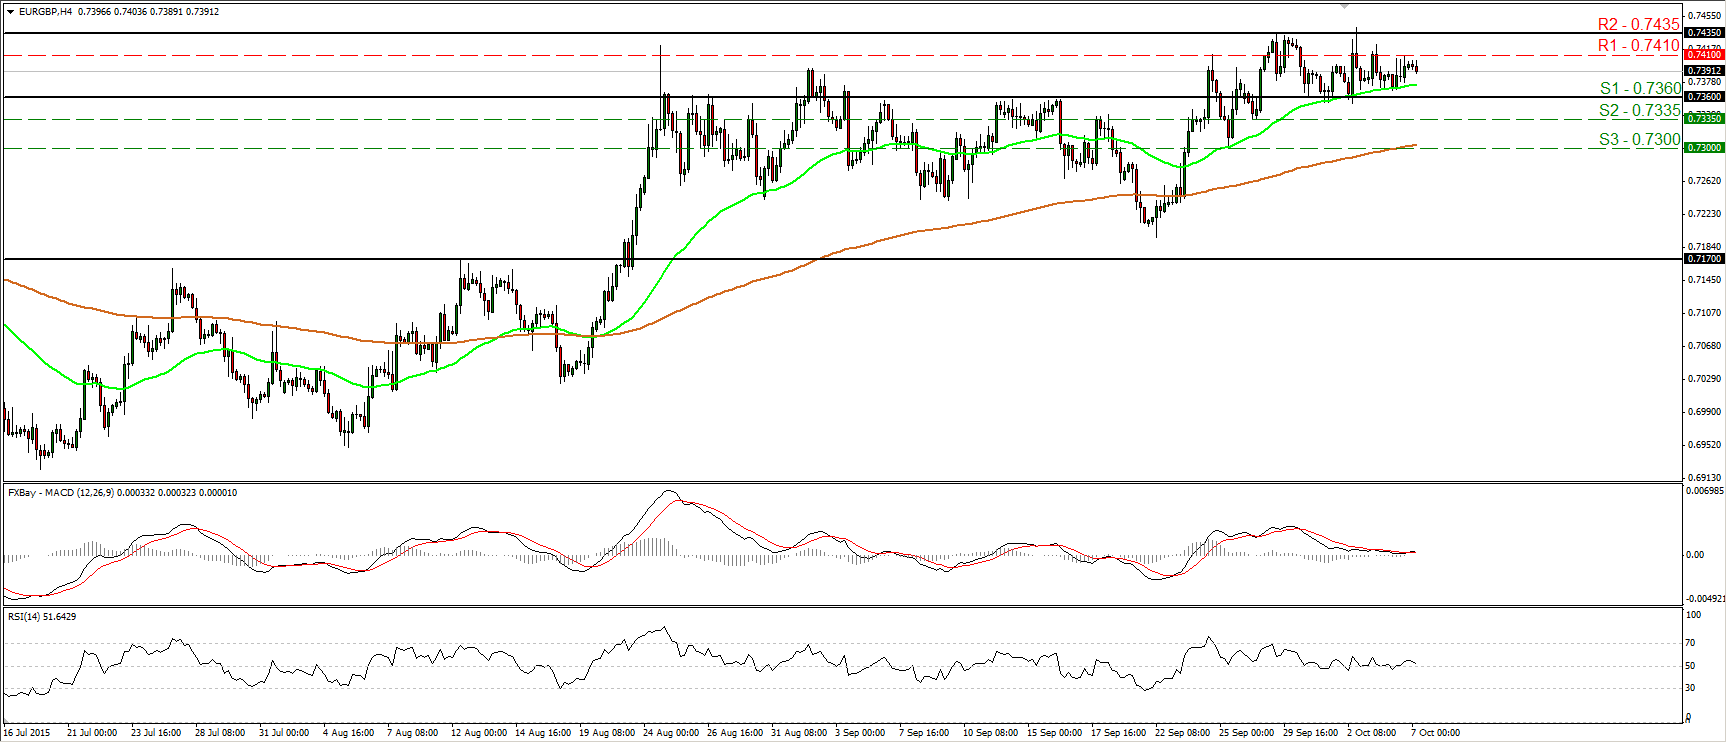
• EUR/GBP has been trading in a consolidative manner since the 28th of September, between the support of 0.7360 (S1) and the resistance of 0.7435 (R2). Yesterday, the rate found resistance at the 0.7410 (R1) line and then retreated somewhat. I would now expect the rate to continue lower and perhaps challenge once again the lower bound of the aforementioned range at 0.7360 (S1). Our short-term momentum studies oscillate around their equilibrium lines, confirming the short-term sideways mode of the pair. As for the broader trend, the move above 0.7170 on the 21st of August has turned the medium-term outlook positive. However, I would like to see a clear close above 0.7435 (R2) before getting again confident on the upside. Something like that could initially aim for the psychological zone of 0.7500 (R3).
• Support: 0.7360 (S1), 0.7335 (S2), 0.7300 (S3)
• Resistance: 0.7410 (R1), 0.7435 (R2), 0.7500 (R3)
USD/JPY hits resistance at 120.55 and slides
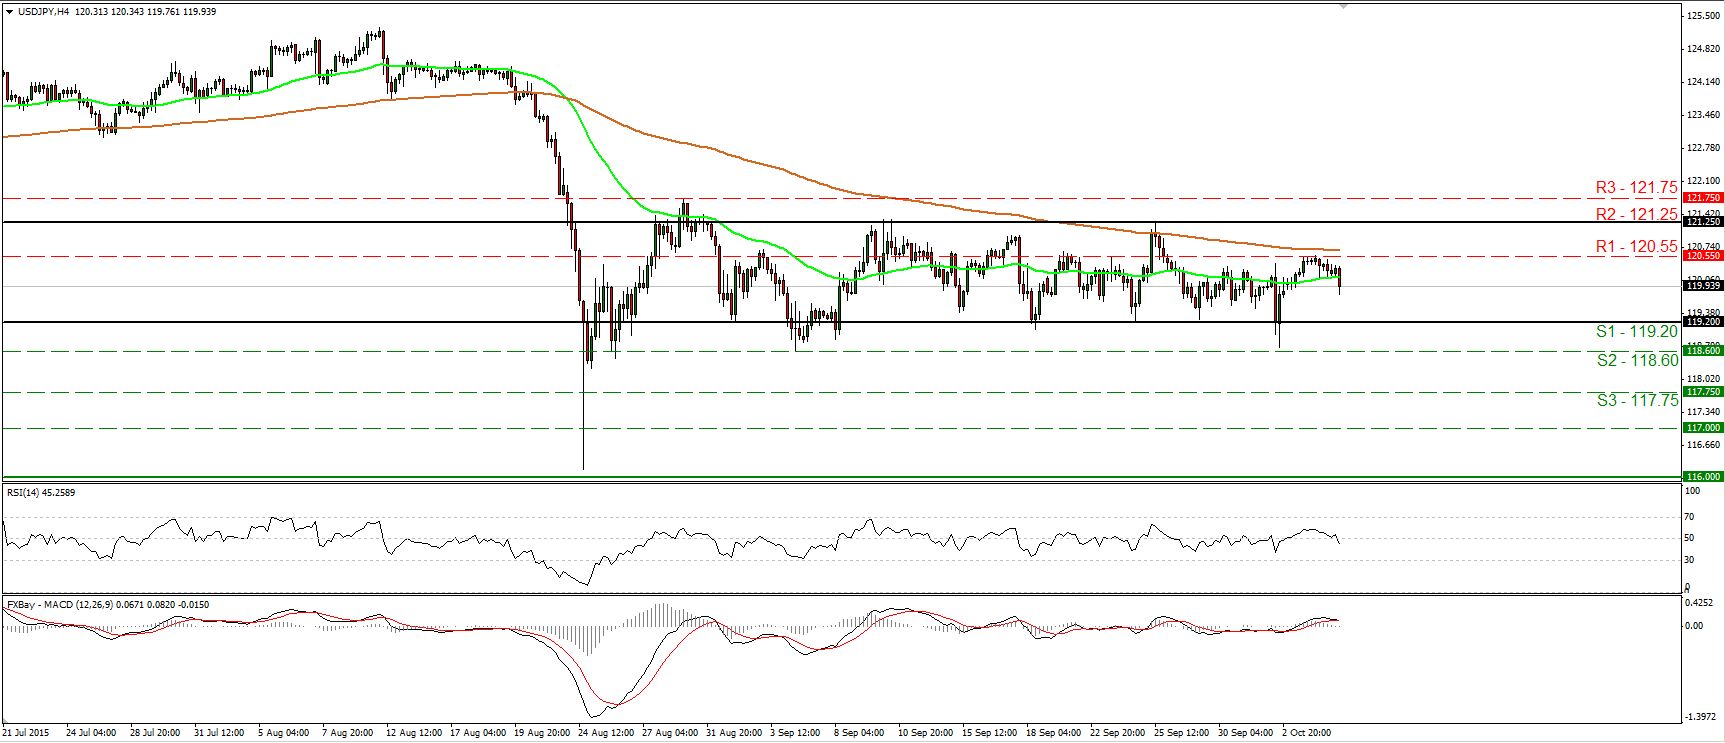
• USD/JPY traded lower on Tuesday, after it hit resistance at 120.55 (R1). The rate is still trading within a sideways range between the support of 119.20 (S1) and the resistance of 121.25 (R2). As a result, I would still consider the short-term outlook to stay neutral. I believe that a break below 119.20 (S1) is needed to turn the near-term picture back to the downside. Something like that could initially aim for the next support at 118.60 (S2). Both our short-term momentum indicators oscillate around their equilibrium lines confirming the sideways mode of the rate. As for the broader trend, the plunge on the 24th of August signaled the completion of a possible double top formation, which turned the medium-term outlook somewhat negative. As a result, I would treat the recovery from the 116.00 zone as a corrective phase and I believe that it is more likely for the pair to exit its short-term sideways range to the downside in the foreseeable future.
• Support: 119.20 (S1), 118.60 (S2), 117.75 (S3)
• Resistance: 120.55 (R1), 121.25 (R2), 121.75 (R3)
Gold hits resistance fractionally above 1150
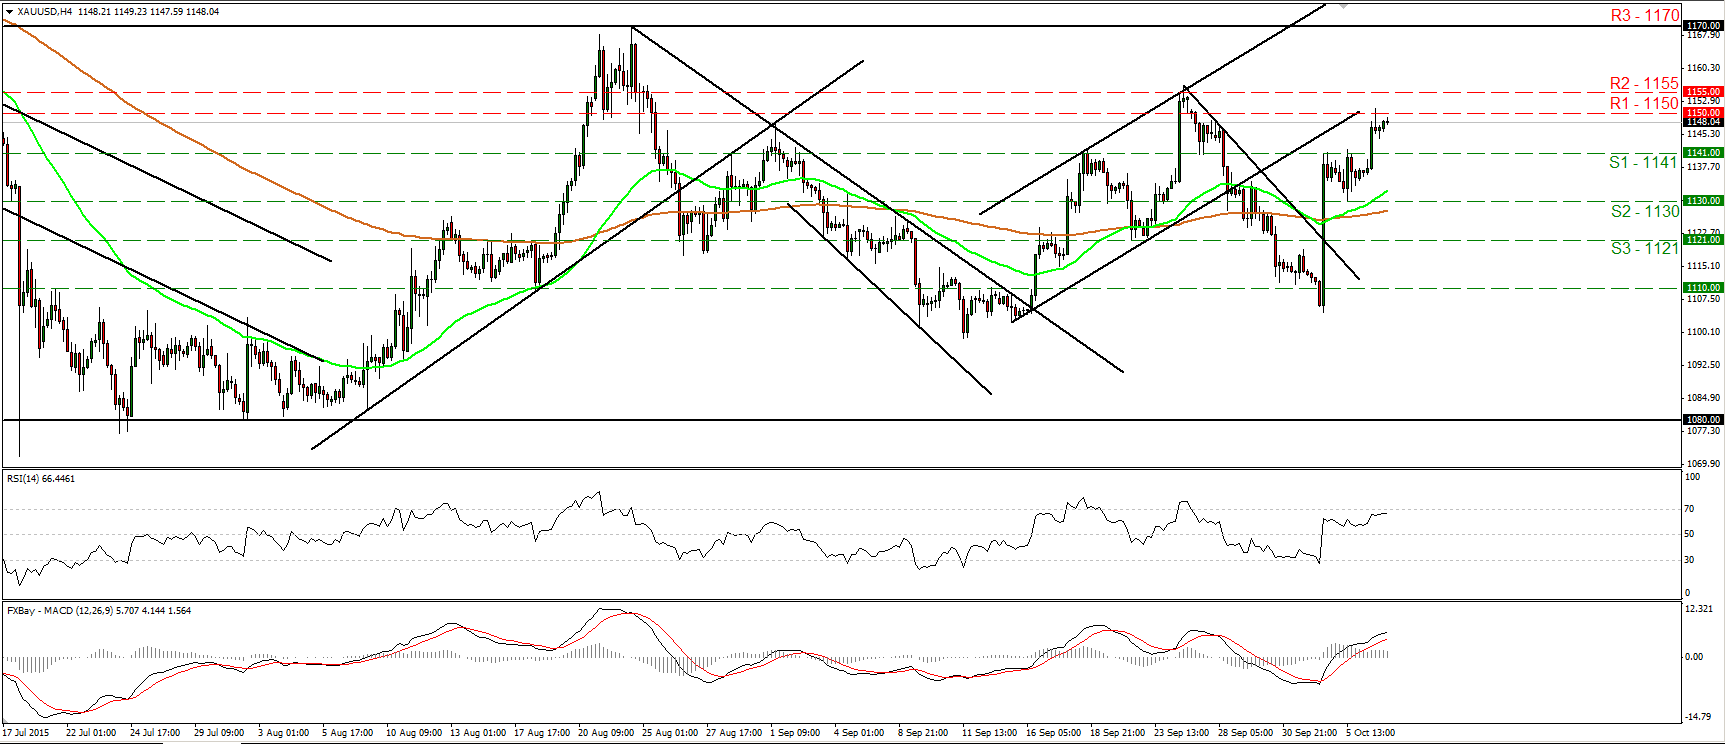
• Gold traded higher yesterday, breaking above the resistance (now turned into support) barrier of 1141 (S1). The advance was stopped fractionally above 1150 (R1), and I would expect another attempt above that zone to target the next resistance at 1155 (R2), defined by the peak of the 24th of September. Taking a look at our short-term oscillators, I see that the RSI moved higher and could cross above 70 soon, while the MACD stands above both its zero and trigger lines, pointing north. As for the bigger picture, with no clear trending structure on the daily chart, I would hold my neutral stance as far as the overall outlook is concerned. I believe that a close above 1170 (R3) is needed to signal a newborn medium-term uptrend. • Support: 1141 (S1), 1130 (S2), 1121 (S3) • Resistance: 1150 (R1), 1155 (R2), 1170 (R3)
WTI breaks out of a sideways range
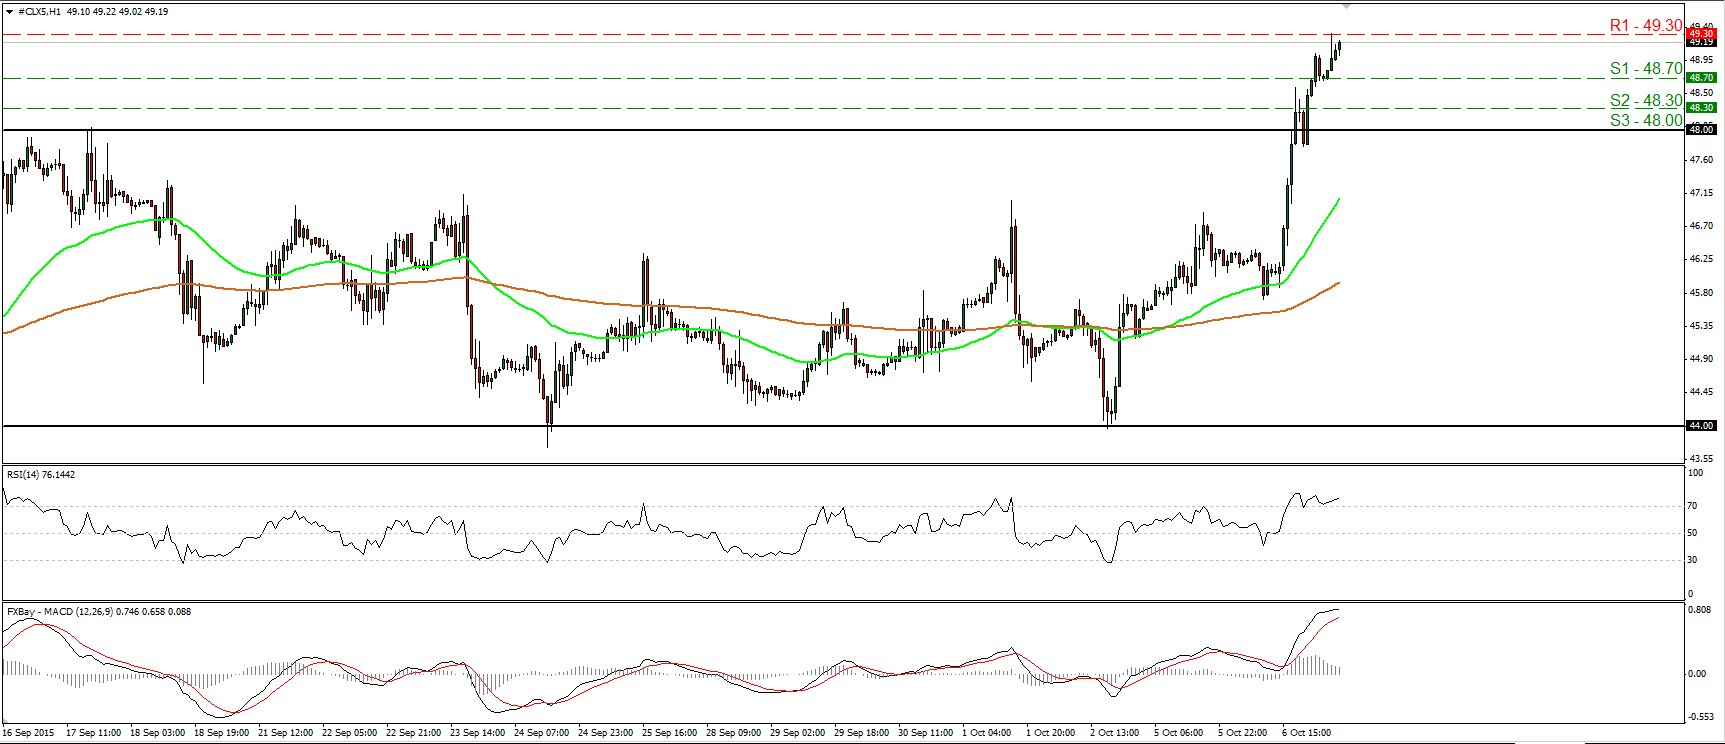
• WTI surged on Tuesday, breaking above 48.00 (S3), the upper bound of the sideways range it’s been trading since the beginning of September. The price now looks ready to challenge once again the 49.30 (S1) obstacle, where a clear break is likely to open the way for the psychological zone of 50.00 (R2). Our hourly momentum indicators detect strong upside speed and support further advances. The RSI, already within its overbought territory, rebounded from its 70 line and is now pointing up again, while the MACD stands well above both its zero and trigger lines. Nevertheless, the MACD shows signs of topping, giving evidence that a possible setback could be on the cards before the bulls take the reins again. In the bigger picture, the upside exit of the aforementioned sideways range has shifted the medium-term outlook somewhat positive in my view.
• Support: 48.70 (S1), 48.30 (S2), 48.00 (S3)
• Resistance: 49.30 (R1) 50.00 (R2), 50.50 (R3)

