• China takes over from Greece A few weeks ago it was Greece, Greece, Greece every day. Yesterday, the country effectively secured an agreement with representatives of its international creditors (at least at the technical level if not yet at the political level). Last month that would have dominated the news, but yesterday it warranted barely a glance – now it’s China, China, China. As well it should be, given the difference in the importance of the countries for the global economy.
• With the Chinese economy slowing and the stock market faltering, investors had been hoping for a Chinese fiscal stimulus package or other measures to support the domestic economy that would also be a spur for global growth. Instead, the country devalued its currency, a move that simply tries to reallocate growth from elsewhere to itself. More exports for China maybe; probably less imports and hence less growth elsewhere.
• Furthermore, yesterday is not likely to be the end of the matter. While the initial depreciation of the currency was less than 2% and was accompanied by a statement saying that this was a “one-off depreciation,” the currency’s officially determined reference rate was down another 1.6% today and apparently the PBOC had to intervene in the market to prevent it from falling further. Furthermore, the PBOC made clear yesterday that the change was a first step towards a more market-determined exchange rate. Given the recent capital outflows, that’s likely to mean an even weaker CNY in the future, as Chinese investors now see downside risk in their currency. As a result, the “currency war” started almost immediately as Vietnam also widened the trading band on its currency yesterday, citing the CNY devaluation as the reason.
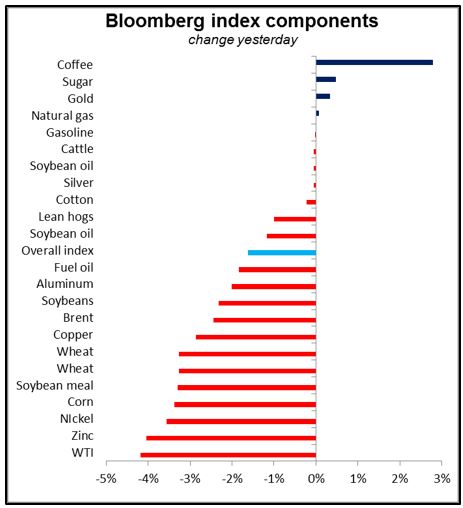
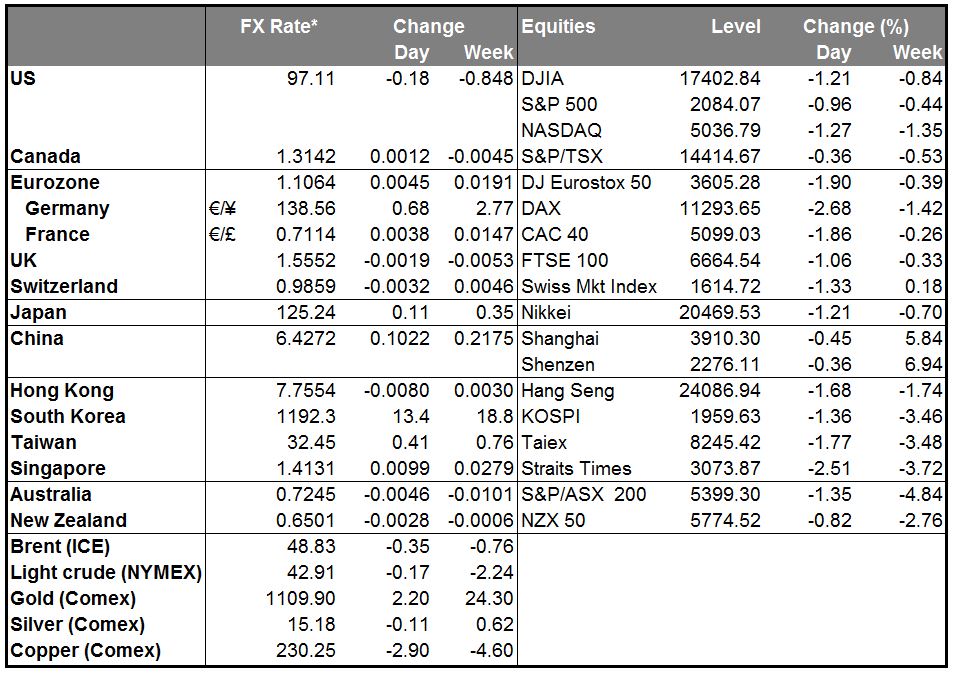
• Markets quickly grasped the implications: WTI was down 4.1% and copper down 3.3%. The EUR 5yr breakeven inflation rate fell 5 bps, as did the US 5yr/5yr inflation swap and yield curves flattened. Fed funds rate expectations plunged 7 or 8 bps as the market tried to assess how the Chinese move would affect central banks elsewhere. Fed Chair Janet Yellen has previously argued that the timing of the first rate hike is less important than how high the rate ends up at – the terminal rate. That’s probably what the Chinese move may affect. The FOMC’s reasoning on why they want to move rates from zero to something is one thing, their thinking for what the appropriate rate for the “new normal” conditions is another. China doesn’t affect the former, but it does affect the latter.
• USD gained against most currencies, as it’s now even less likely that other countries will ever raise their rates. The commodity currencies – AUD, NZD, CAD – were particular losers. I expect that they will continue to decline so long as the fears over China growth dominate. On the other hand, the Eastern European currencies – HUF, CZK and PLN – gained as they are net importers of commodities. There may be an opportunity here for a “terms of trade” trade: buy the importers, sell the exporters.
• Chinese data shows no improvement Meanwhile, China released several indicators this morning that showed no improvement from the previous month. Retail sales, industrial production and fixed asset investment for July were all either at the same pace as in June or lower, despite various measures the government has been taking to shore up the economy. This underscores the limited impact that the measures so far have had and the difficulties the country will have in boosting growth. They also show how much further the government has to go in restructuring its economy: with fixed asset investment rising 11.2% yoy, even if that’s down from 11.4% yoy the previous month, we can hardly say that the growth model has shifted from investment-led to consumption-led.
• Today’s highlights: During the European day, Sweden’s PES unemployment rate for July is coming out at 4.1%, exactly in line with expectations.
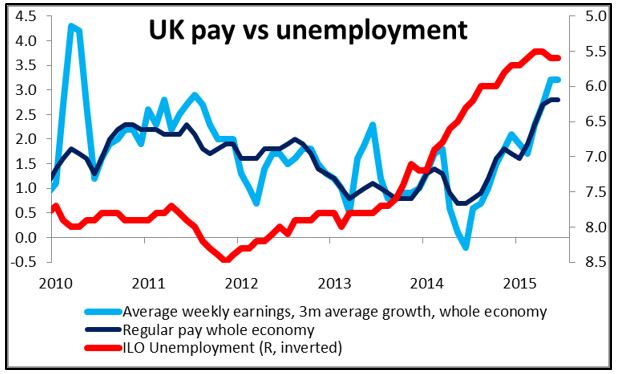
• In the UK, we get the unemployment rate for June. Another decline in the rate and acceleration in the growth of average weekly earnings could support Gov. Carney’s recent comment that the timing for a rate rise is “drawing closer.” With UK inflation rate just above zero and expected to remain muted for some time, given the recent drop in oil prices again, market participants will be closely watching the labor data for signs of demand-pull inflation. Therefore, another strong wage growth is likely to strengthen GBP.
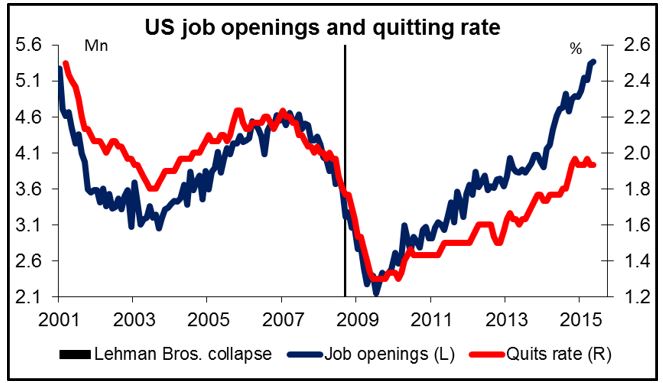
• In the US, only data of secondary importance are coming out. The Job Opening and Labor Turnover Survey (JOLTS) report for June is due out and the forecast is for a moderate decline in the number of job openings. This survey will also bring the “quit rate,” a closely watched indicator of how confident people are in getting another job and by deduction how confident they are in the job market.
• New York Fed President William Dudley speaks today. Given that it takes two points to draw a line, investors are likely to pay a lot of attention to what Dudley, one of the most dovish members of the Committee, has to say. If even he is talking about a rate hike in September, then people will draw a line between him and Atlanta Fed President Lockhart and conclude that most other members are somewhere on that line and that there is probably a general consensus to hike next month.
The Market
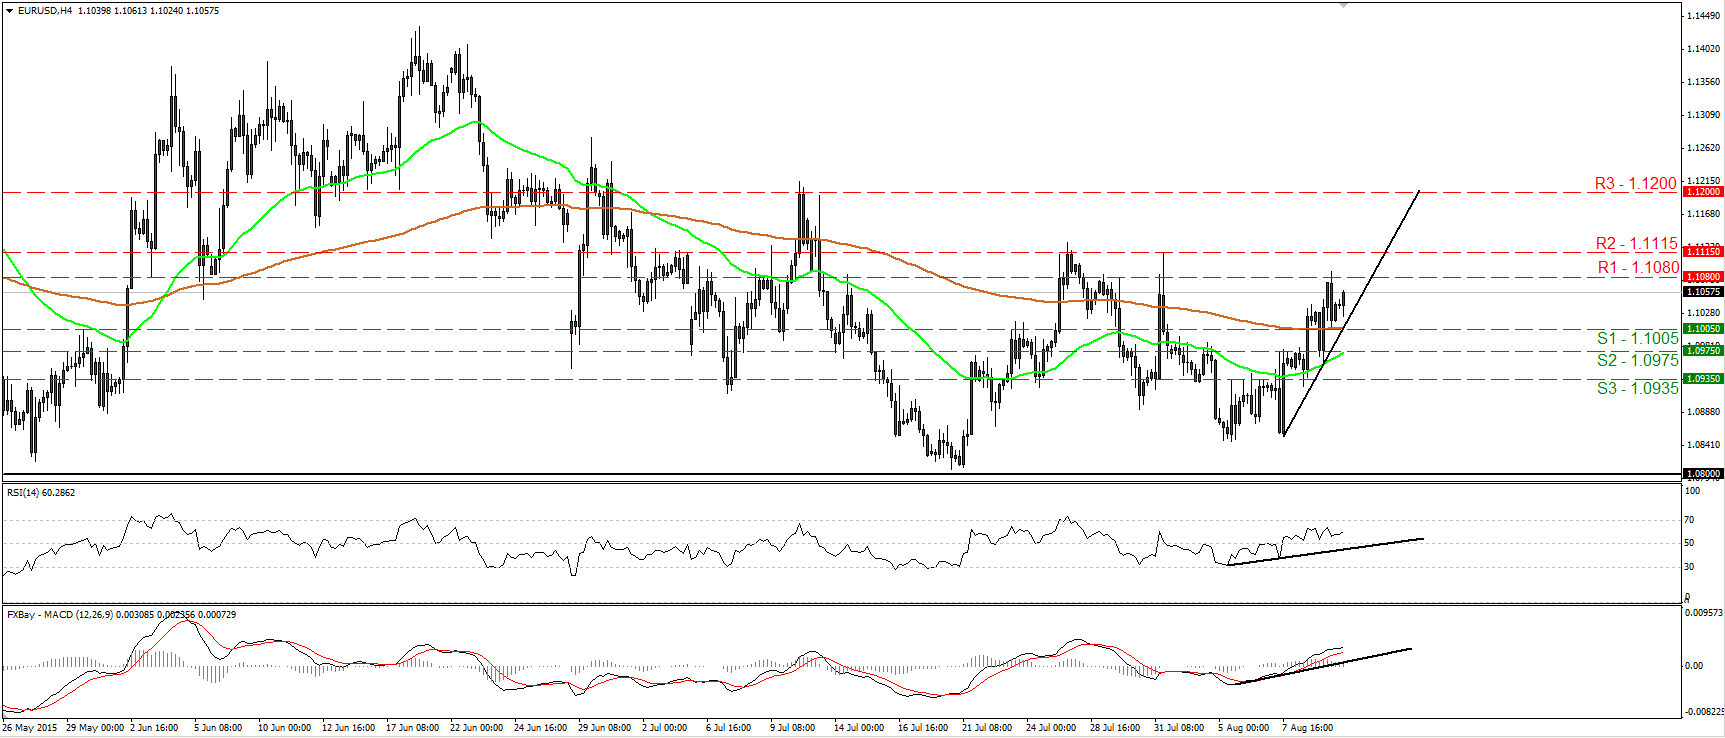
EUR/USD reaches the 1.1080 resistance barrier
• EUR/USD continued trading higher on Tuesday, hit resistance at 1.1080 (R1) and then retreated to find support at 1.1005 (S1). Subsequently, the rate rebounded and is now headed for another test at 1.1080 (R1). I still believe that the short-term outlook remains positive and that a move above 1.1080 (R1) is likely to target the next resistance at 1.1115 (R2), defined by the peak of the 31st of July. Our momentum studies detect positive momentum and support the notion. The RSI, already above its 50 line, has turned up again, while the MACD stands above both its zero and trigger lines. As for the broader trend, as long as EUR/USD is trading between 1.0800 and 1.1500, I would consider the longer-term picture to stay flat. I believe that a move above the psychological zone of 1.1500 is the move that could carry larger bullish implications, while a break below 1.0800 is needed to confirm a forthcoming lower low on the daily chart and perhaps turn the overall bias back to the downside.
• Support: 1.1005 (S1), 1.0975 (S2), 1.0935 (S3)
• Resistance: 1.1080 (R1), 1.1115 (R2), 1.1200 (R3)
GBP/USD trades lower ahead of the UK employment data
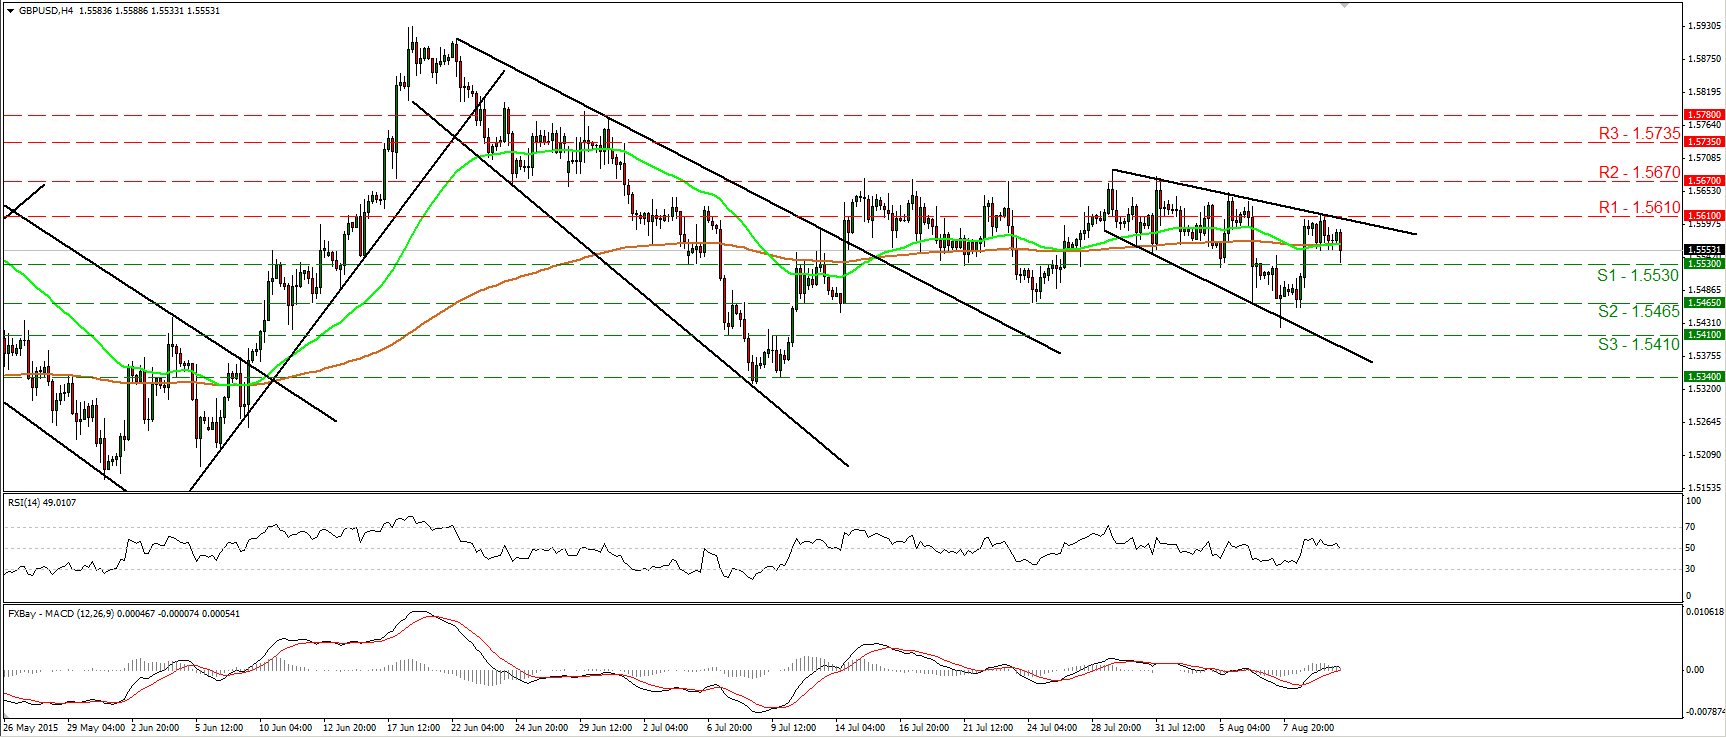
• GBP/USD traded lower yesterday after finding resistance at the 1.5610 (R1) line. Today, during the early European morning, the rate tested the support barrier of 1.5530 (S1), where a decisive break is likely to set the stage for extensions towards our next support of 1.5465 (S2). Our momentum studies corroborate the view that cable could trade lower for a while. The RSI turned down and just crossed below its 50 line, while the MACD, slightly above zero, shows signs of topping and possibly turning negative again. As for the broader trend, the price structure on the daily chart still suggests an uptrend. What is more, cable is still trading above the 80-day exponential moving average. However, given that buyers failed several times to overcome the 1.5670 (R2) barrier, I would hold a neutral stance as far as the overall outlook is concerned.
• Support: 1.5530 (S1), 1.5465 (S2), 1.5410 (S3)
• Resistance: 1.5610 (R1), 1.5670 (R2), 1.5735 (R3)
EUR/JPY breaks above the 138.00 area
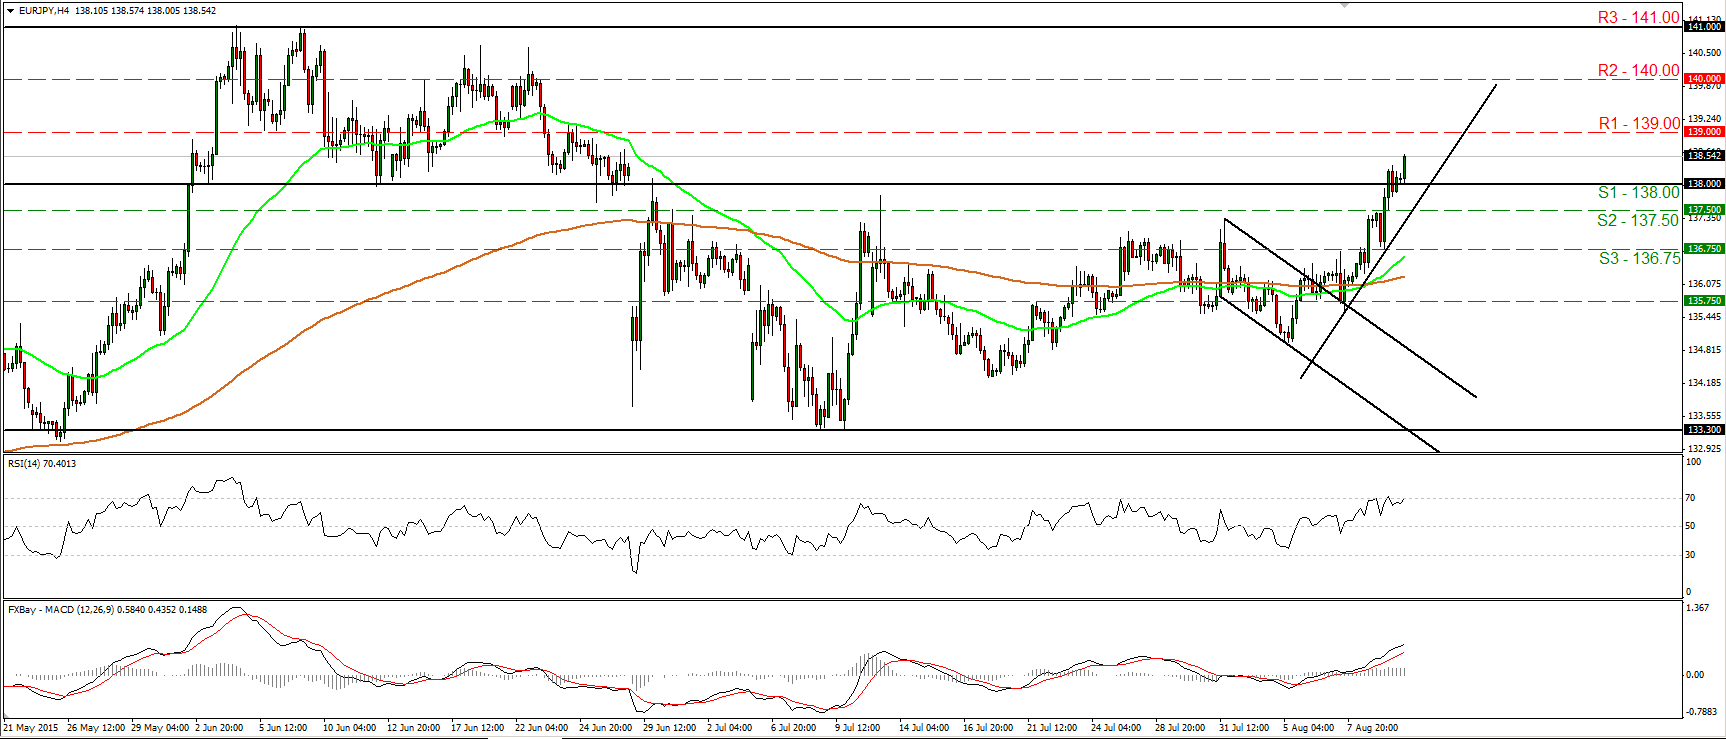
• EUR/JPY traded higher yesterday and managed to break above the key resistance (now turned into support) zone of 138.00 (S1). The price structure suggests a short-term uptrend, and therefore, I would expect the rate to continue higher and challenge the 139.00 (R1) zone. A break above that resistance is likely to see scope for extensions towards the psychological area of 140.00 (R2). Our oscillators reveal strong upside speed and magnify the case for further advances. The RSI just poked its nose above its 70 line and is pointing up, while the MACD stands well above both its zero and trigger lines, pointing north as well. On the daily chart, the pair is still trading above the 133.30 support area, which stands marginally below the 50% retracement level of the 14th of April – 4th of June advance. What is more, it still stands above the medium-term uptrend line taken from the low of the 14th of April. As a result, I would consider the medium-term trend to be positive as well.
• Support: 138.00 (S1), 137.50 (S2), 136.75 (S3)
• Resistance: 139.00 (R1), 140.00 (R2), 141.00 (R3)
Gold hits resistance near 1120
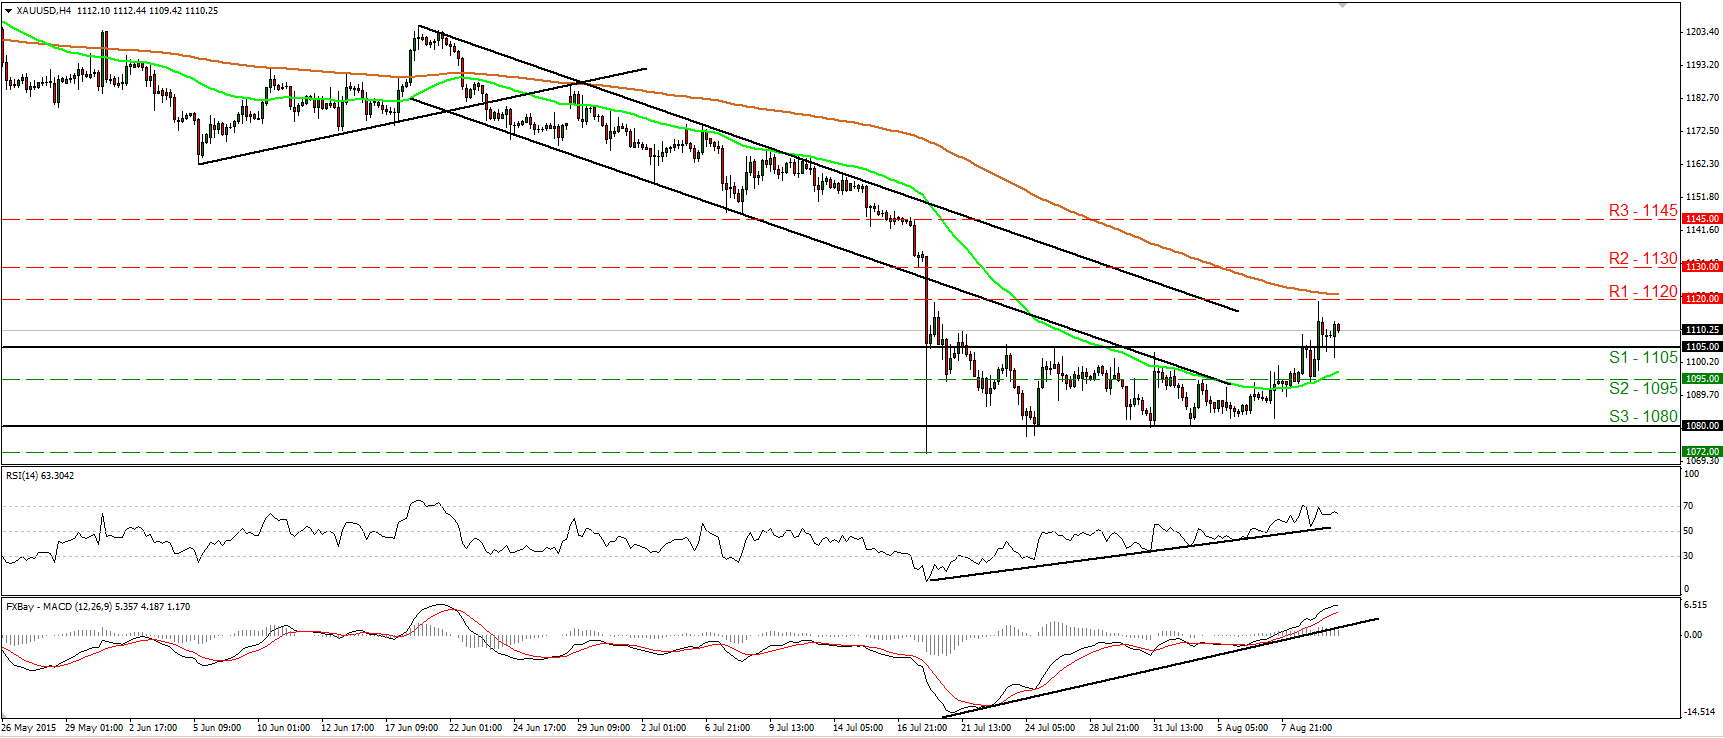
• Gold traded higher on Tuesday, breaking above the resistance zone of 1105 (R1), and reached the next hurdle area of 1120 (R1). Then the metal pulled back. I believe that since the rate broke the upper bound of the sideways range it’s been trading in recently, the short-term outlook is positive. A break above the 1120 (R1) barrier is likely to target the 1130 (R2) barrier. However, taking a look at our short-term oscillators, I would be careful of further pullback before the next positive leg. The RSI hit resistance at its 70 line again and slid, while the MACD shows signs of topping. In the bigger picture, the plunge on the 20th of July triggered the continuation of the longer-term downtrend and this keeps the overall bias of the yellow metal to the downside in my view. As a result, I would treat any further positive near-term waves as corrective moves.
• Support: 1105 (S1), 1095 (S2), 1080 (S3)
• Resistance: 1120 (R1), 1130 (R2), 1145 (R3)
WTI tumbles and hits support at 42.70
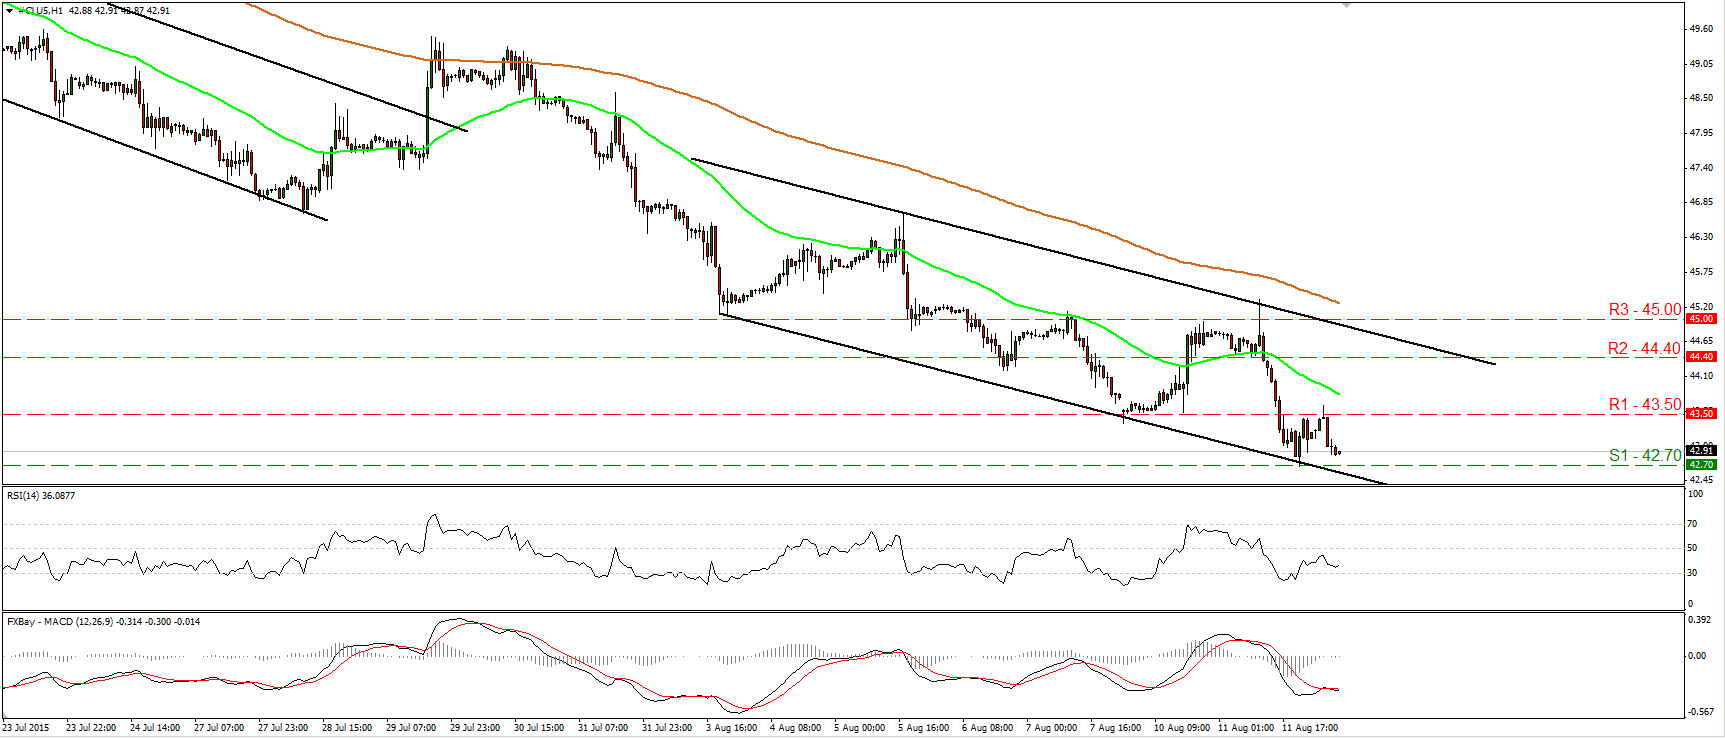
• WTI tumbled on Tuesday to find support at 42.70 (S1). Then it rebounded, hit resistance slightly above 43.50 (R1), and retreated again. During the early European morning Wednesday, WTI is headed for another test at the 42.70 (S1) barrier, where a clear dip could target the 42.00 (S2) zone. Another break below the latter zone could set the stage for extensions towards the psychological round figure of 40.00 (S3). Our hourly oscillators detect downside momentum and amplify the case that WTI could continue to trade lower. The RSI has topped below its 50 line, while the MACD, at extreme low levels, crossed again below its trigger line. On the daily chart, price structure has been lower peaks and lower troughs since the 24th of June. Therefore, I would consider the longer-term trend to be negative as well.
• Support: 42.70 (S1), 42.00 (S2), 40.00 (S3)
• Resistance: 43.50 (R1) 44.40 (R2), 45.00 (R3)

