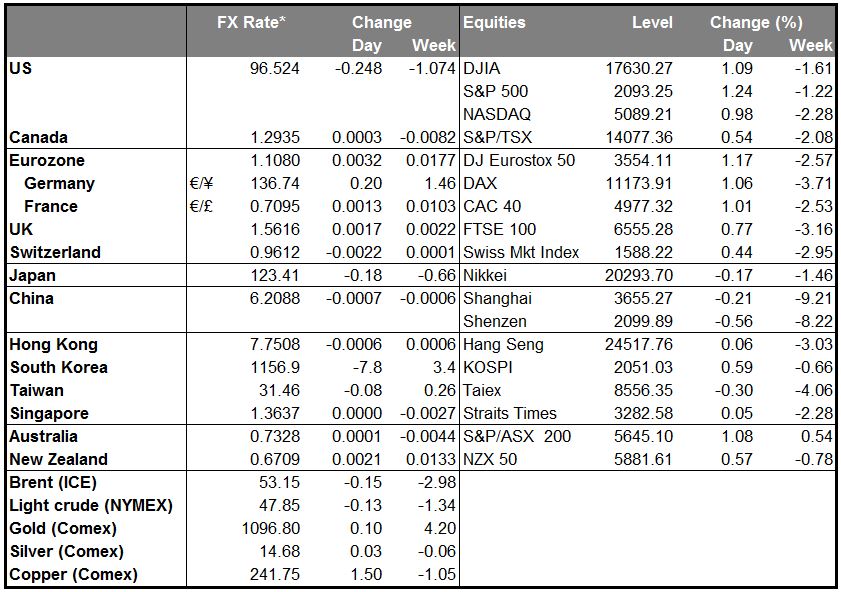
• A bit better tone There was a bit better tone to markets today. Chinese stocks were up at the opening and managed to poke their nose above yesterday’s close now and then, although at the time of writing they had slipped back into negative territory. Commodities were doing much better, with oil, most metals and about half the agricultural commodities rising. The calm in the Chinese market may be due to news that the China Securities Regulatory Commission set up a legal enforcement taskforce to check for clues related to the plunge in stocks on Monday, which is yet another sign that the government will do whatever it can to keep the market from collapsing.
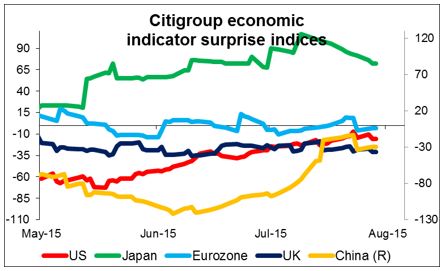
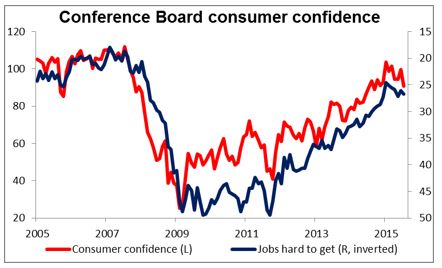
• USD lower nonetheless Nonetheless, the dollar continued to deteriorate. Over the past few days, the dollar fell as the turmoil in China caused Fed funds rate expectations to retreat, but the dollar has continued to fall even though China stabilized and Fed funds rate expectations were steady yesterday. This may have been because of the disappointing US consumer confidence figures yesterday, which missed expectations by the largest amount since 2010. The view on jobs deteriorated as well. The economic surprise index for the US has started to turn down recently, indicating that US economic indicators have been disappointing recently. This may be hurting the dollar, although it’s notable that the same trend is visible in most other regions as well. US growth may well be slowing, but if so, it’s only part of a general slowdown in global growth.
• A change in expectations may hit the dollar more than other currencies for the simple reason that nobody expects a change in most other currencies’ monetary regime for some time, so economic conditions may have less bearing on their currencies. Only USD and GBP rates are expected to change within the foreseeable future, so a change in the economic outlook will only affect the outlook for those currencies, or at least will affect them more than the others.
• NZD was the best-performing G10 currency after Reserve Bank of New Zealand Gov. Graham Wheeler said that NZD should fall further, but ruled out sharply lower interest rates. ““At current levels of export prices, a more substantial exchange rate depreciation will be required to stabilise the net external liabilities position relative to GDP,” he said. He also predicted that tightening by the Fed and BoE could help NZD to ease. Nonetheless, he also said that large declines in interest rates would only be consistent with the economy moving into recession, and he didn’t see that happening. The statement reduced expectations of a large cut in rates and supported NZD. I expect that the rebound in NZD may be temporary, however, largely because I’m still concerned about China, its growth prospects and its stock market. Moreover, as I mentioned yesterday, China may be aiming to allow the CNY to depreciate and that could dampen demand in China for New Zealand’s milk. I expect milk prices to fall further and for NZD to fall with them.
• USD fell vs most EM currencies as well, except TRY, which collapsed further. RUB was lower as well despite the rise in oil prices. The rebound in EM currencies was nothing like the recent falls, however, showing only modest short-covering. It seems that the market’s view on these currencies remains negative, not surprisingly.
• Today’s highlights: The main event today is, of course, the results of the two-day FOMC policy meeting. I don’t think it’s going to be a major event. There is no update to the forecasts and no press conference following the meeting. The Committee will probably just tweak the first paragraph of the statement, the one that gives their view of the current economic conditions. The recent Beige Book showed that conditions continue to improve modestly, so they are likely to raise their evaluation of the economy somewhat, but not enough to shift anyone’s expectations about whether they are going to pull the trigger at the next meeting in September. For that, we’ll probably have to wait till the minutes of the meeting are released on Aug. 19th.
• Chair Yellen said recently that the labor market is getting “demonstrably closer” to normal, so labor isn’t a major bone of contention. The biggest thing that I’ll be looking for in the statement is any new comment on inflation. The gap between core inflation, currently running at 1.2%, and the Fed’s goal of 2% is still a major hurdle to tightening. I will also be looking for any comments on the dollar. A recent Fed paper determined that the earnings of U.S. foreign subsidiaries account for about 25% of the overall profits of US nonfinancial corporations, and the dollar's strength likely explains roughly a third of the recent decline in profits earned from foreign subsidiaries. So 1/3rd of 25% = 8% of the decline in US profits was due to the strength of the dollar; significant, but probably not enough to make them hold off changing policy.
• As for the impact of the statement, after the April meeting, the last time there was no press conference, EUR/USD fell from 1.1170 to 1.1076, so about 1 cent, then rebounded to trade around 1.1120, so net net down 50 cents. USD/JPY moved 35 pips. GBP fell then 60 pips then came back 30, for a net decline of 30 pips. So there was some good volatility at the time of the announcement, but it didn’t cause a new trend.
• Of course, if they say anything that really puts a date on lift-off, then it could be different. But they’ve been quite clearly for some time now that it’s meeting-by-meeting dependent on the data, so I don’t think the statement will say anything beyond what Chair Yellen said at her recent testimony, namely that if the economy continues to perform in line with expectations, then liftoff later this year will be appropriate.
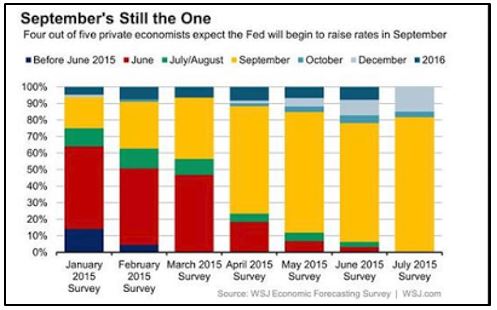
• Around four out of five economists believe that’s going to be in September, although the Fed funds futures for September are only at 18 bps, indicating that the market still has a lot of doubts. That’s why there could still be a surprise, at least in September. But probably not in July.
• As for today’s indicators, the German GfK consumer confidence index for August and the French consumer confidence index for July are coming out. Neither is a market affecting indicator though.
• Norway’s AKU unemployment rate for May is forecast to have risen to 4.3% from 4.2%. The official unemployment rate for May however, declined to 2.7% from 2.9%. This increases the possibilities for the AKU rate to decline as well, something that could support NOK.
• In the US, pending home sales for June are forecast to have risen at the same pace as in May. Housing starts, building permits, and existing home sales for the same month all beat estimates, and therefore, we could see another positive surprise in pending home sales. This could prove USD-positive.
The Market
EUR/USD hits support at 1.1020
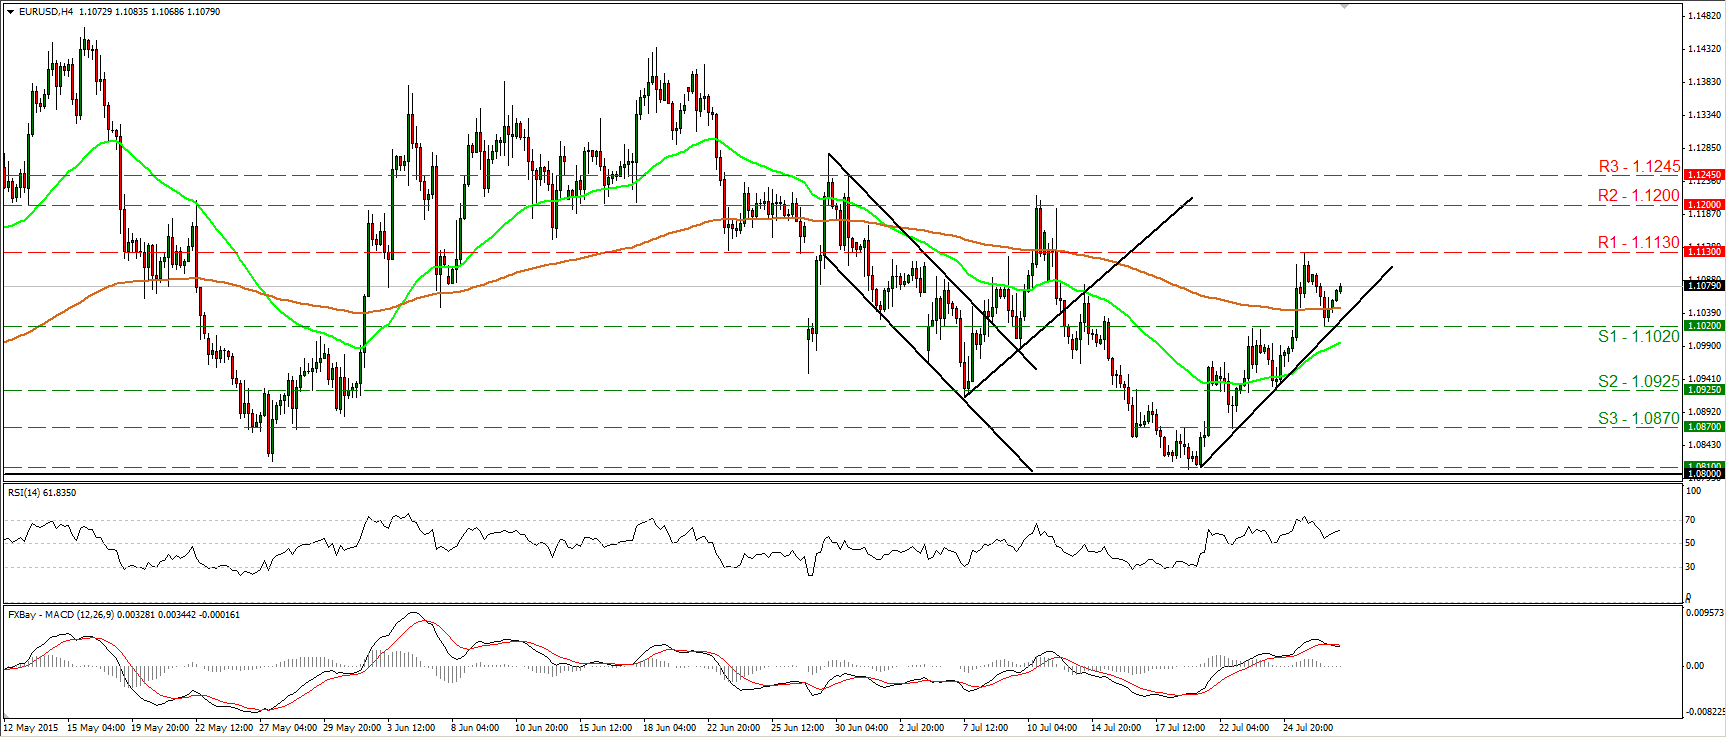
•EUR/USD pulled back on Tuesday, but after hitting support at 1.1020 (S1), it rebounded. On the 4-hour chart, the price structure still suggests a short-term uptrend. Therefore, I would expect the bulls to continue driving the battle higher and to challenge once again the 1.1130 (R1) resistance barrier. A clear break above 1.1130 (R1) is likely to set the stage for extensions towards the 1.1200 (R2) hurdle. The RSI rebounded from slightly above its 50 line, while the MACD could move back above its trigger line soon. These signs show that the momentum is turning positive again and they support the case that EUR/USD could continue trading higher in the short run. As for the broader trend, as long as the pair is trading between 1.0800 and 1.1500, I would see a neutral longer-term picture. I believe that a move above the psychological zone of 1.1500 is the move that could carry larger bullish implications, while a break below 1.0800 is needed to confirm a forthcoming lower low on the daily chart and perhaps turn the overall bias back to the downside.
•Support: 1.1020 (S1), 1.0925 (S2), 1.0870 (S3)
•Resistance: 1.1130 (R1), 1.1200 (R2), 1.1245 (R3)
EUR/JPY hits support at 136.35
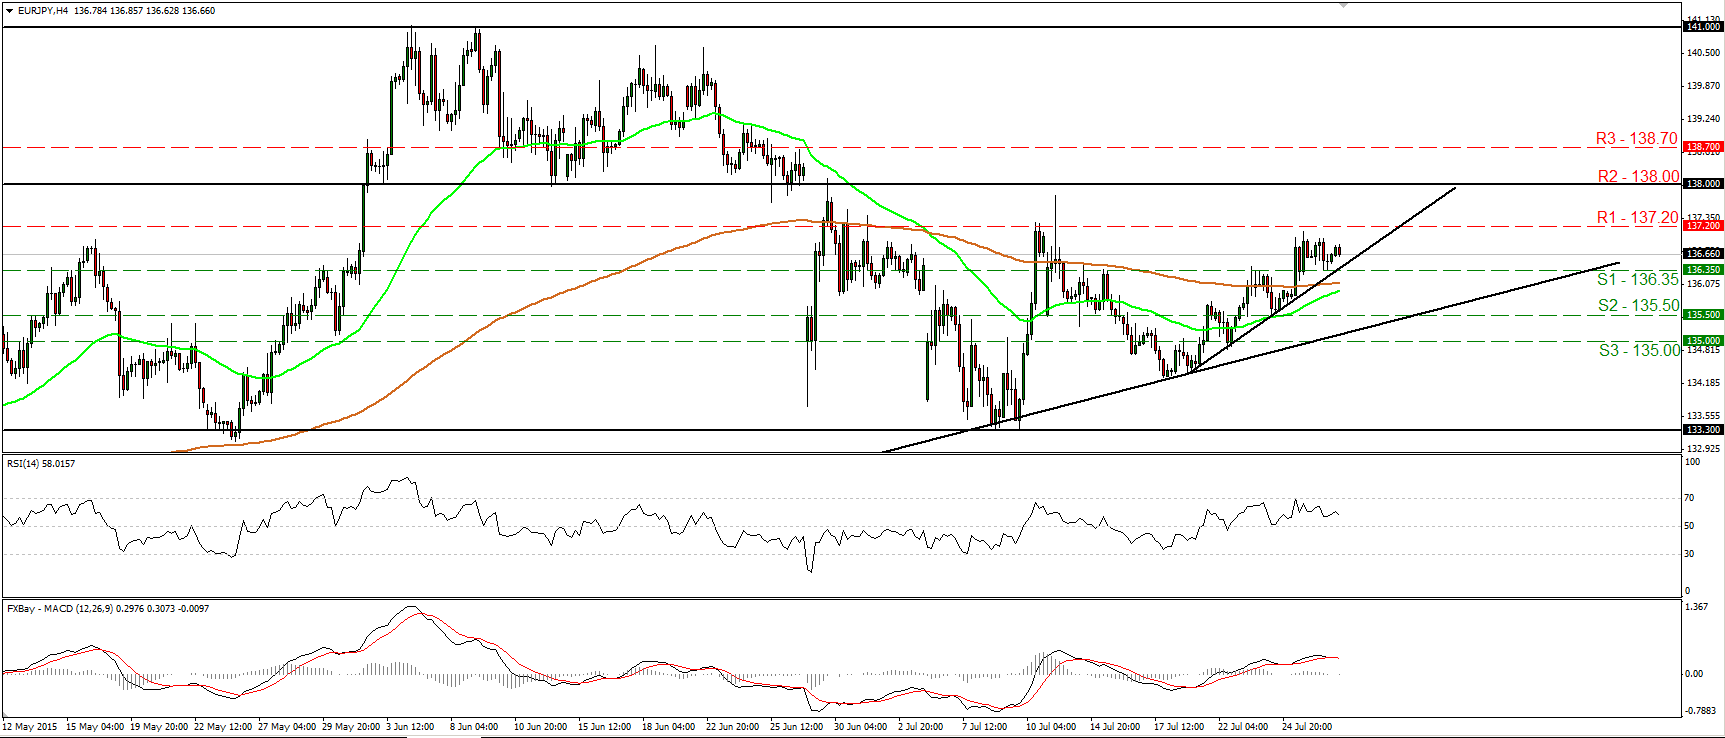
•EUR/JPY hit support at the 136.35 (S1) barrier and traded somewhat higher on Tuesday. On the 4-hour chart, the price structure seems to be higher peaks and higher troughs above the short-term uptrend line taken from the low of the 20th of July. As a result, I would see a somewhat positive short-term picture. A break above 137.20 (R1) is the move that would confirm a forthcoming higher high and perhaps pave the way for the next resistance zone of 138.00 (R2). Nevertheless, our momentum studies indicate that a downside corrective move could be on the cards. The RSI, although above 50, has turned down, while the MACD has topped and fallen below its trigger line. On the daily chart, the pair is still trading above the 133.30 support area, which stands marginally below the 50% retracement level of the 14th of April – 4th of June advance. As a result, I would consider the medium-term picture to be cautiously positive. I would like to see a daily close below that area before I assume that the medium-term picture has turned negative.
•Support: 136.35 (S1), 135.50 (S2), 135.00 (S3)
•Resistance: 137.20 (R1), 138.00 (R2), 138.70 (R3)
NZD/USD races higher after Wheeler’s comments
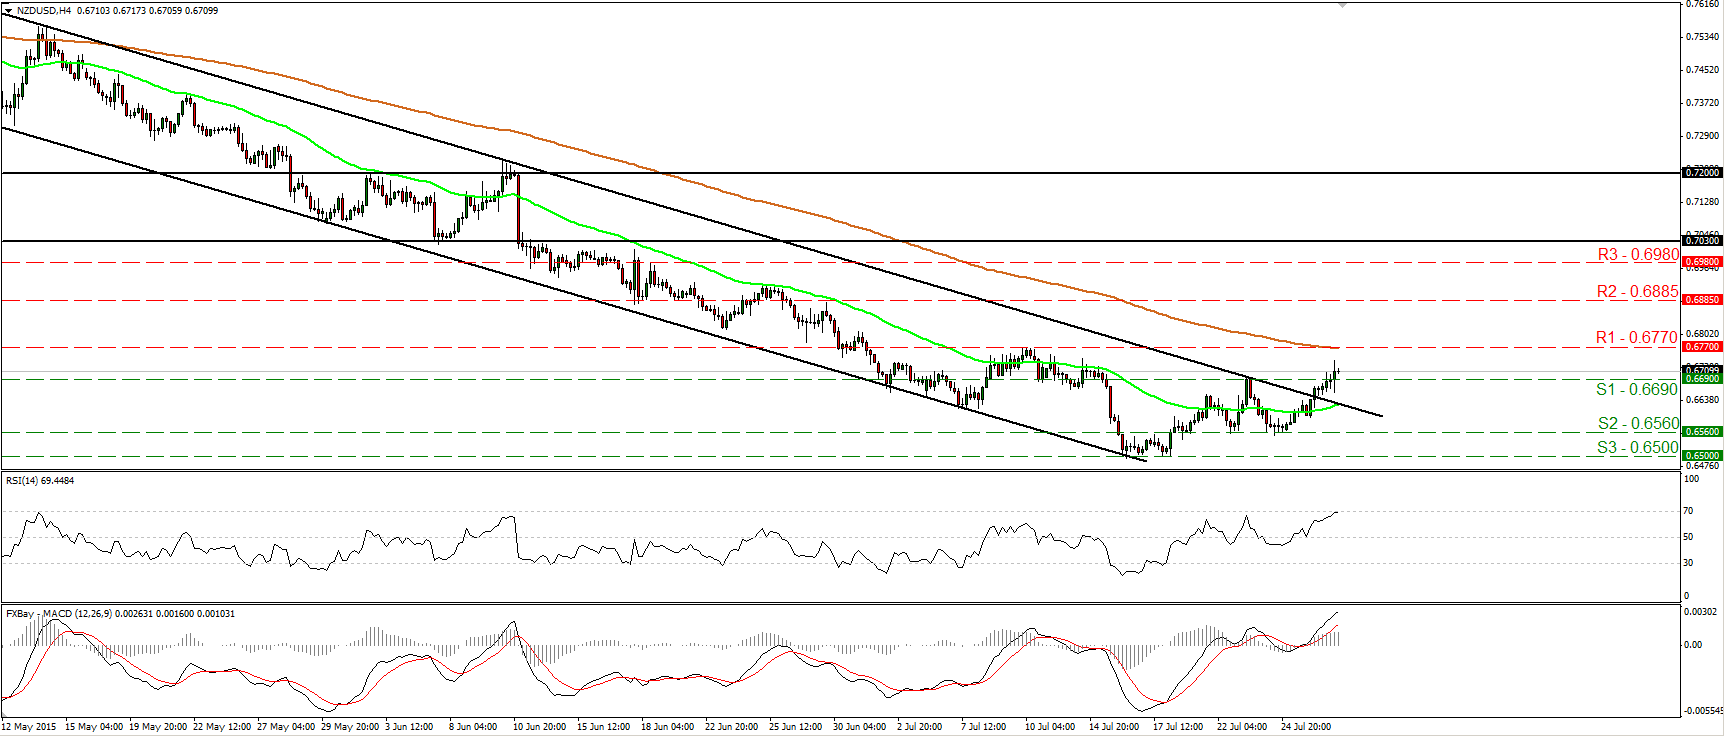
• NZD/USD raced higher during the Asian morning Wednesday after RBNZ Governor Wheeler said that NZD should be weaker consistent with current economic conditions, but sharply lower interest rates are not the way to that goal. The pair broke above the resistance (now turned into support) barrier of 0.6690 (S1), and I would now expect it to challenge the 0.6770 (R2) barrier. A break above that obstacle could prompt extensions towards the 0.6885 (R2) territory. Our short-term momentum studies support that NZD/USD could continue trading higher in the near term. The RSI is testing its 70 line and could move above it soon, while the MACD stands well both its zero and signal lines and points north. Switching to the daily chart, I see that after breaking below the lower line of a rising wedge formation on the 1st of May, NZD/UZD accelerated lower. The price structure has been lower peaks and lower troughs and this keeps the overall outlook negative in my opinion. As a result, I would treat the rebound from the psychological zone of 0.6500 (S3), or any extensions of it, as a corrective phase of the larger downside path.
• Support: 0.6690 (S1), 0.6560 (S2), 0.6500 (S3)
• Resistance: 0.6770 (R1), 0.6885 (R2), 0.6980 (R3)
WTI rebounds and finds resistance slightly above 48.25
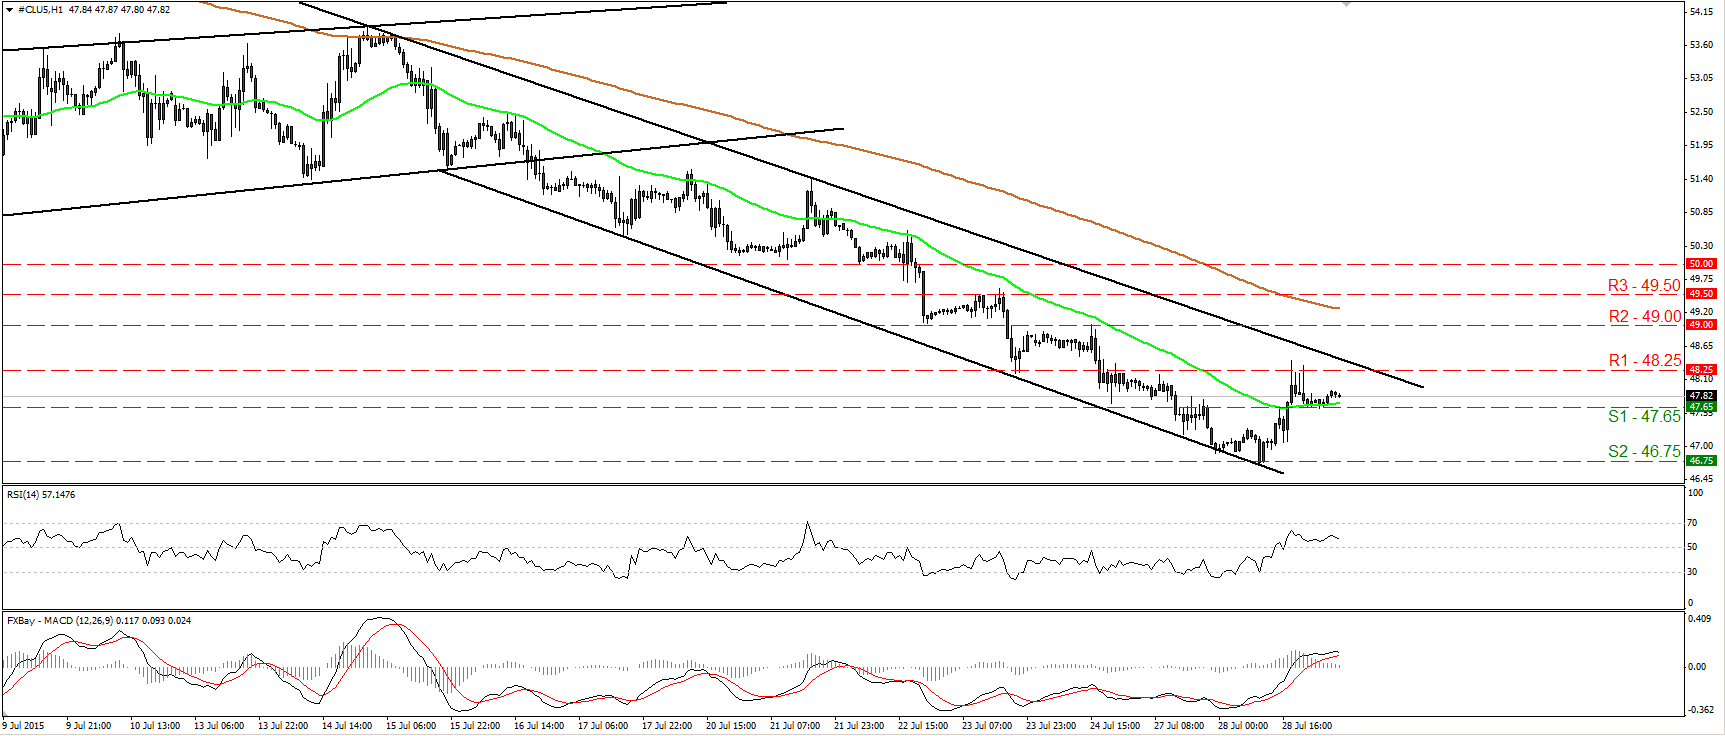
•WTI hit support at 46.75 (S2) and rebounded strongly to find resistance slightly above the 48.25 (R1) line. WTI is still trading within a downside channel, and therefore, the short-term picture remains negative in my view. A clear move below the 47.65 (S1) line is likely to confirm the case, and perhaps open the way for another test at 46.75 (S2). Our hourly oscillators give evidence that yesterday’s rebound was just a corrective move, and that the next wave is likely to be negative. The RSI has turned down and it could be headed back towards its 50 line, while the MACD has topped and could fall below its trigger line any time soon. On the daily chart, I see that the medium-term trend is negative as well. Moreover, our daily oscillators detect strong downside speed and magnify the case for further declines. The 14-day RSI stays below its 30 line, while the daily MACD stands below both its zero and signal lines.
•Support: 47.65 (S1), 46.75 (S2), 45.00 (S3)
•Resistance: 48.25 (R1) 49.00 (R2), 49.50 (R3)
Gold stays slightly below 1100
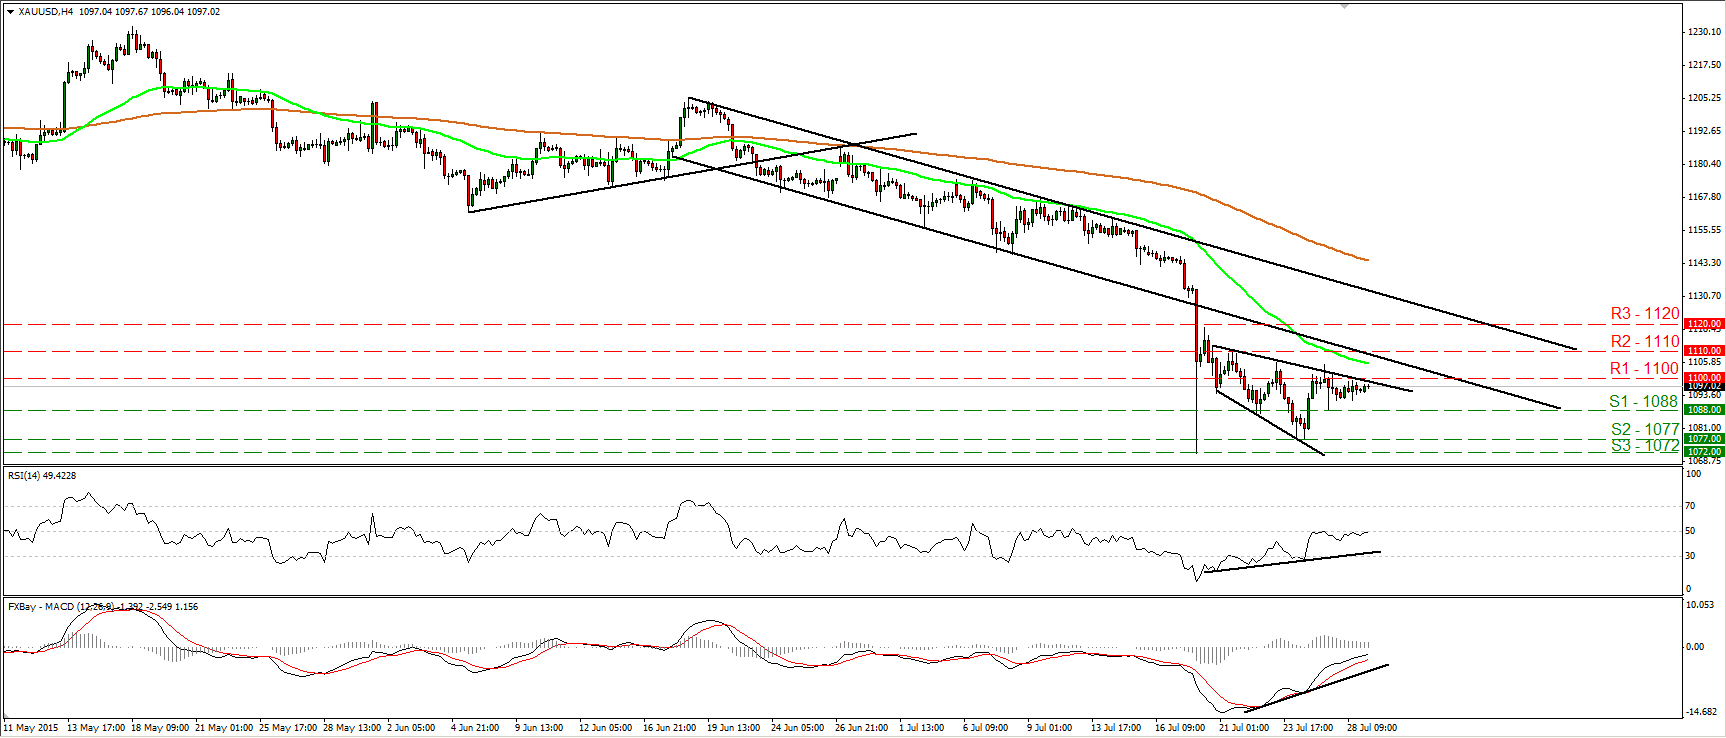
•Gold traded in a consolidative manner yesterday, staying slightly below the resistance hurdle of 1100 (R1). As long as the metal is printing lower peaks and lower troughs below the lower line of the short-term downside channel that had been containing the price action from the 18th of June until the 20th of July, I would consider the short-term outlook to remain negative. I would expect sellers to eventually take control again and aim for another test at the 1077 (S2) hurdle. Looking at our short-term oscillators though, I would stay cautious that an upside corrective move could be looming before the next leg down. The RSI looks able to move above its 50 line, while the MACD stands above its trigger line and is headed towards its zero line. Moreover, there is positive divergence between both these indicators and the price action. In the bigger picture, the plunge on the 20th of July triggered the continuation of the longer-term downtrend and kept the overall bias of the yellow metal to the downside in my view.
• Support: 1088 (S1), 1077 (S2), 1072 (S3)
•Resistance: 1100 (R1), 1110 (R2), 1120 (R3)
BENCHMARK CURRENCY RATES - DAILY GAINERS AND LOSERS

MARKETS SUMMARY
