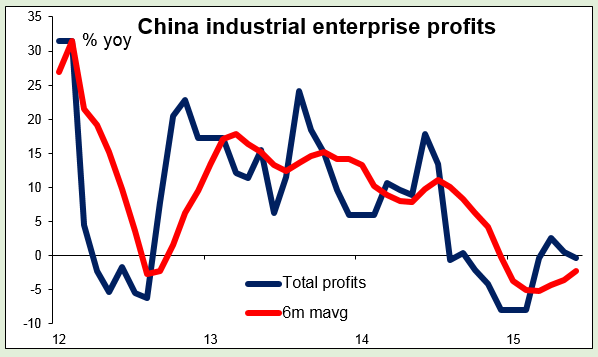
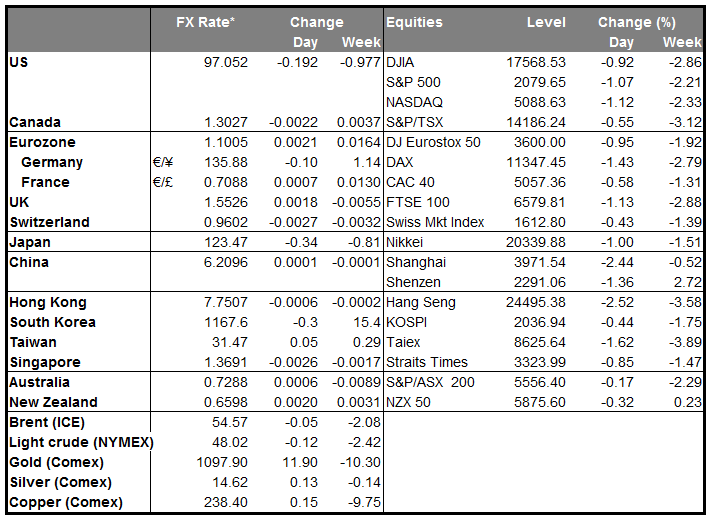
•Stocks fall around the world as commodities slump Stock markets fell around the world on Friday and continued to decline in Asia on Monday as the selloff in commodities only worsened. The Bloomberg pages with commodity prices are largely red; only some of the metals are higher this morning, such as tin, copper and some of the precious metals. News that China’s industrial enterprises’ profits declined 0.3% from a year earlier in June, after two months of yoy gain, corroborated last week’s fall in the China manufacturing PMI and reinforced the idea that Chinese growth was likely to slow and demand for commodities was likely to slow with it.
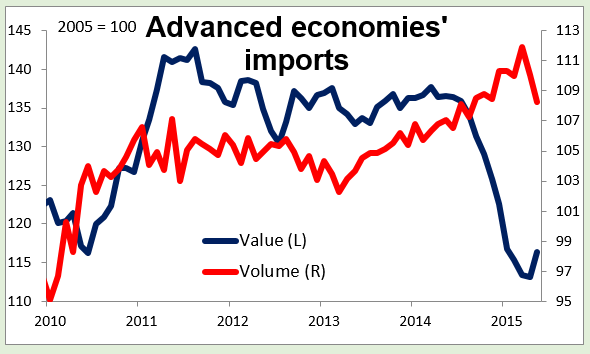
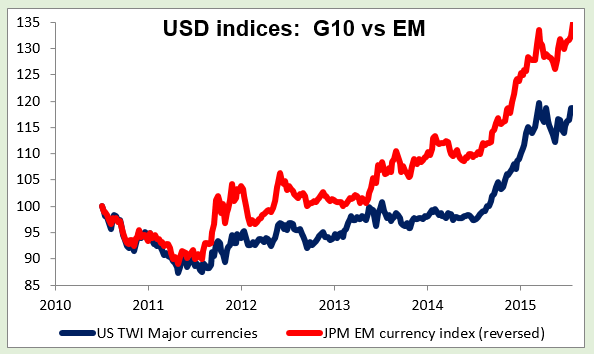
• Dollar down vs G10, up vs EM With commodity prices, particularly oil, falling so sharply, inflation is likely to be subdued. In such an environment, the need for Fed tightening is diminished and as a result, Fed funds rate expectations declined again on Friday. This is putting downward pressure on the dollar vs the G10 currencies. However, the US unit is stable to higher against most of the EM currencies that we track, with the commodity-heavy BRL, RUB and ZAR leading the way down. (The worst performing EM currency was TRY, which plunged as the country launched attacks on ISIS targets in Syria and Kurds in Iraq.) It’s noticeable that the weakness in EM currencies has not translated into an increase in these countries’ exports. Total global trade grew only 0.4% yoy by volume in May, as imports by the advanced economies rose only 1.1% yoy vs an average of 3.1% yoy in the last six months of 2014. By value, imports by the advanced economies plunged 13.9%. The sharp difference in the volume and value indices shows the deterioration in the terms of trade for these EM countries and explains to a large degree why their currencies are depreciating. Note how much better the dollar has performed relative to the JP Morgan EM currency index than against the major currencies.
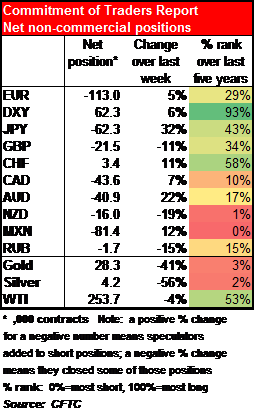
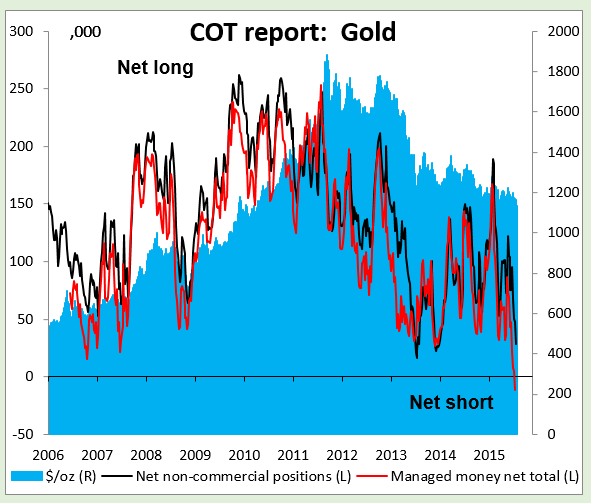
• COT report: managed funds go net short gold The weekly Commitment of Traders (COT) report showed that investors largely added to their existing positions during the week, increasing their USD longs and currency shorts. JPY and AUD shorts saw particularly large increases. On the other hand, investors trimmed short positions in GBP and NZD. The most interesting positioning though was in gold. Speculative investors (i.e., hedge funds) are now holding extremely small long positions by historical standards, and if we look at the category “managed money net total,” which includes commodity funds, they are net short gold for the first time ever (data going back to June 2006).
• Today’s indicators: During the European day, we get the German Ifo survey for July. The weak ZEW indices released earlier this month added to the recent soft data coming out from the country. The expectations index declined from the previous month, while the moderate increase in the current situation index was not enough to reverse the negative sentiment towards Eurozone’s largest economy. Therefore, another weak Ifo reading could add to evidence that the bloc’s growth engine is losing steam.
• In the US, durable goods orders for June are expected to rise, a rebound from the month before, while durable goods excluding transportation equipment are estimated to remain unchanged in pace. The focus is usually on the core figure, where a positive surprise could suggest the possible start of a turnaround in business investment that could be bullish for the dollar.
• As for the rest of the week, the highlight will be the FOMC meeting for July on Wednesday. With no press conference scheduled or new forecasts, the focus will be on the accompanying statement for investors to judge if September could be the month when Fed begins the process of normalizing interest rates. We expect no significant changes from the June statement, just perhaps some tweaks to the first paragraph, the one in which they describe the current economic environment. One point to watch out for is the voting. Any dissent in favor of hiking rates would probably shift the market’s expectations about the timing of the first rate hike and thereby support the dollar.
• On Tuesday, the main event will be the UK’s 1st estimate of Q2 GDP. The forecast is for the growth rate to accelerate on qoq basis, while the annual rate is estimated to decelerate a bit. Given the weak industrial production in April and May and the poor retail sales figures in Q2, there is a chance of some disappointment in the Q2 growth figure. On the other hand, a strong positive surprise along with the recent hawkish stance by several central bank members could encourage the bulls to push the pound higher.
• On Thursday, the German CPI for July is coming out. As usual, we will look at the larger regions for a guidance on where the headline figure may come in and thereby as an indication for the near-term direction of EUR. As the Greek drama comes to an end, investors may start paying less attention to politics and more attention to the economic data. A rise in the German CPI rate could indicate a rise in the Eurozone’s CPI to be released on Friday, and strengthen EUR a bit.
• In the US, the 1st estimate of Q2 GDP is expected to rebound from Q1. This is in line with the Fed’s expectations for a stronger Q2 growth, and could provide a boost to USD. Given that Fed hiking expectations are in focus again after Yellen reaffirmed that she expects to start hiking within the year, the dollar is becoming increasingly data-driven and significant positive data surprises are likely to keep USD in a bullish trend. The 1st estimate of the core personal consumption index, the Fed’s favorite inflation measure, is also coming out.
• Finally on Friday, during the Asian trading session, we have the usual end-of-month data dump from Japan. The focus will be on the National CPI rate for June and the Tokyo CPI rate for July, after comments by Governor Kuroda that he expects the inflation to accelerate considerably in the coming months due to a tight labour market. On top of that, at the last BoJ policy meeting, the members reaffirmed their view that they expect to meet their 2% inflation target sometime around the first half of next fiscal year. A rise in the CPI rate would support Bank officials’ optimism and probably strengthen JPY somewhat.
The Market
EUR/USD is headed towards 1.1020
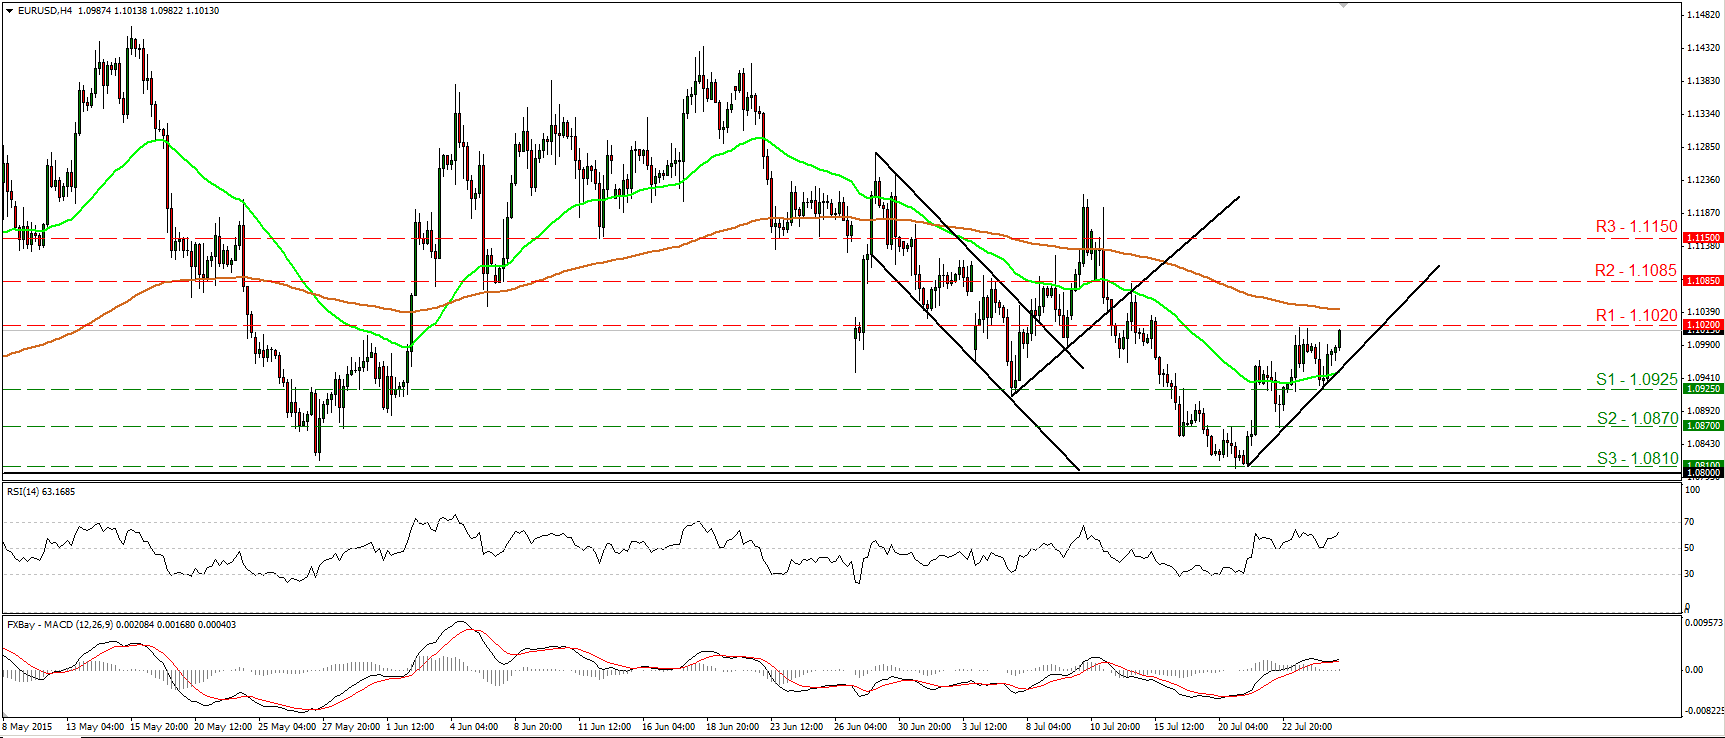
• EUR/USD traded higher on Friday and during the early European morning Monday, is headed towards the resistance line of 1.1020 (R1). On the 4-hour chart, the price structure still suggests a short-term uptrend. Therefore, I would expect a decisive move above 1.1020 (R1) to open the way for the 1.1085 (R2) barrier. Our short-term oscillators support the notion. The RSI rebounded from its 50 line and now points up, while the MACD, already positive, rebounded from near its trigger line.
• As for the bigger picture, as long as the pair is trading between 1.0800 and 1.1500, I see a neutral longer-term picture. I believe that a move above the psychological zone of 1.1500 is the move that could carry larger bullish implications, while a break below 1.0800 is needed to confirm a forthcoming lower low on the daily chart and perhaps turn the overall bias back to the downside.
• Support: 1.0925 (S1), 1.0870 (S2), 1.0810 (S3)
• Resistance: 1.1020 (R1), 1.1085 (R2), 1.1150 (R3)
GBP/USD rebounds from 1.5465
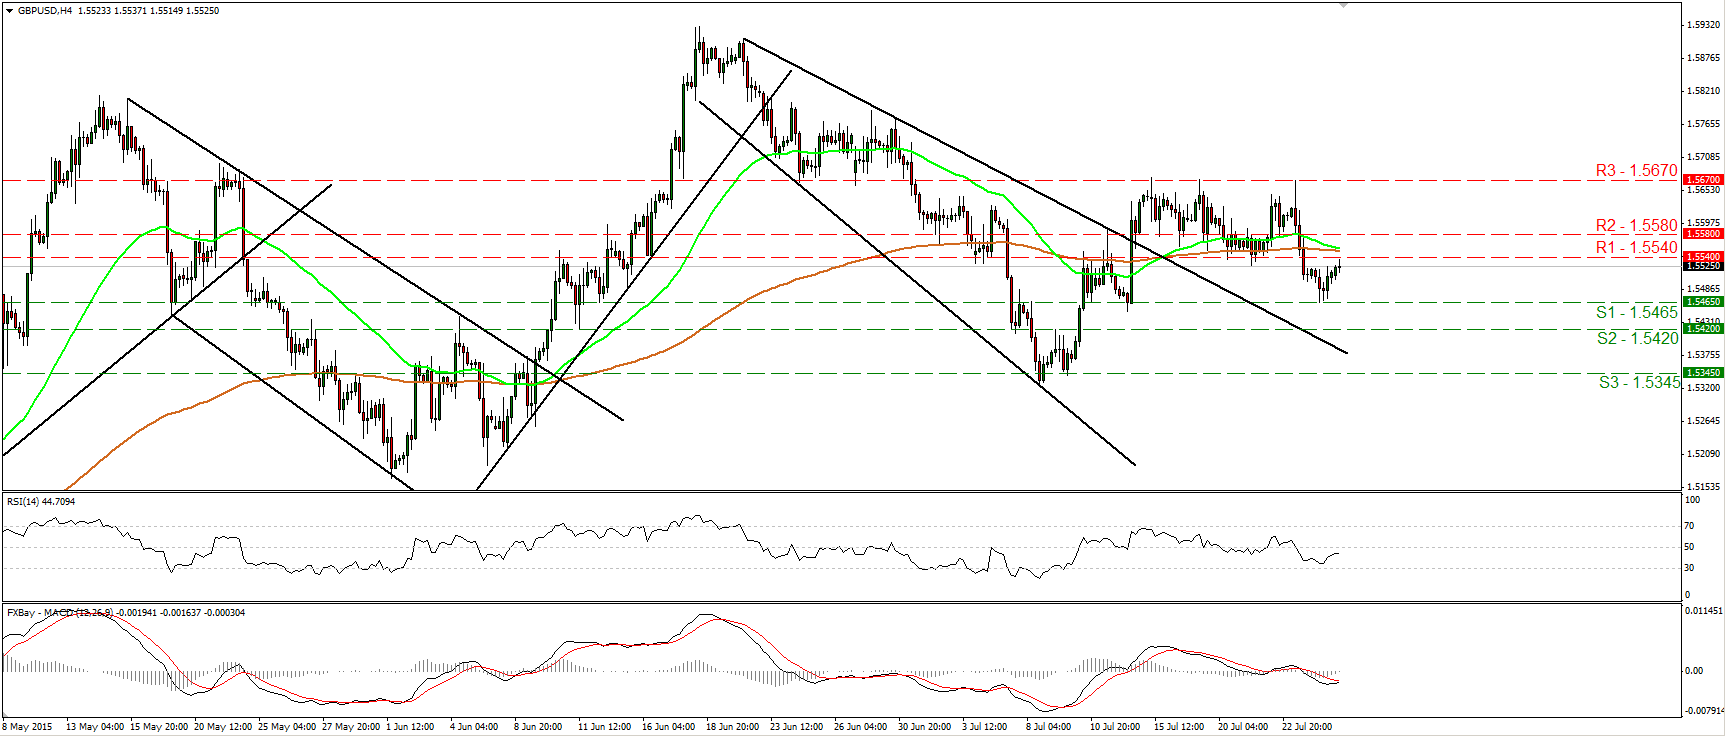
• GBP/USD found support at 1.5465 (S1) on Friday and rebounded to hit resistance at 1.5540 (R1). Taking a look at our oscillators, I would expect the rebound to continue for a while. The RSI rebounded from above its 30 line and is now headed towards its 50 barrier, while the MACD has bottomed and could cross above its trigger line any time soon. A break above 1.5540 (S1) is likely to initially target the next resistance of 1.5580 (R2). On the daily chart, at the time of the rebound, the 1.5465 (S1) support coincided with the 80-day exponential moving average. This makes me believe that the overall picture remains somewhat positive and that there is still the likelihood for the rate to trade higher in the not-to-distant future.
• Support: 1.5465 (S1), 1.5420 (S2), 1.5345 (S3)
• Resistance: 1.5540 (R1), 1.5580 (R2), 1.5670 (R3)
USD/JPY breaks below 123.60
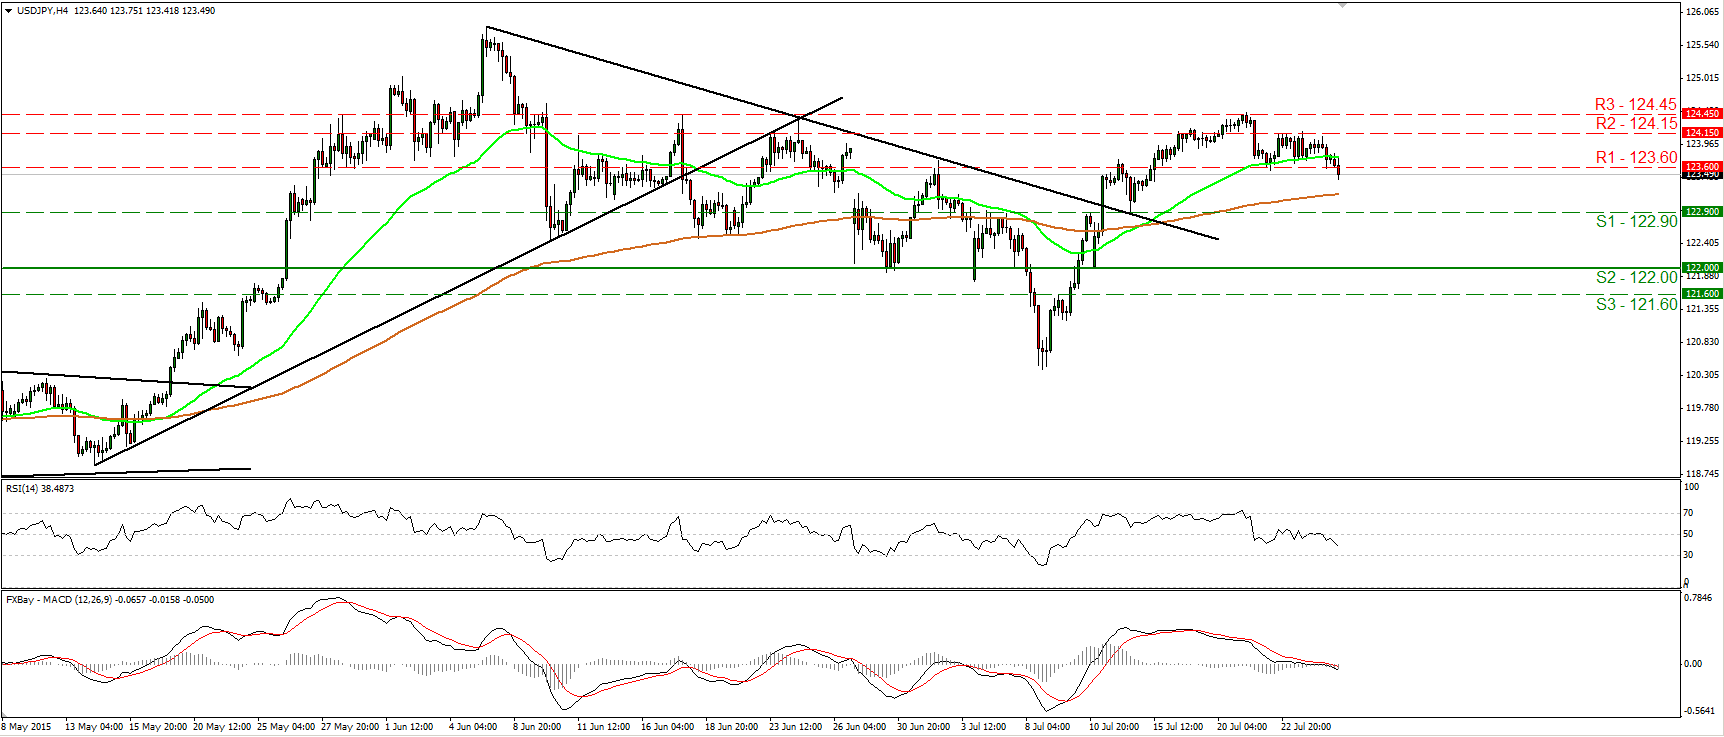
• USD/JPY slid on Friday and today during the Asian day, it fell below the support (now turned into resistance) barrier of 123.60 (R1). That move confirmed a forthcoming lower low on the 4-hour chart and turned the short-term picture negative, in my opinion. I would now expect the bears to pull the trigger for the 122.90 (S1) barrier, marked by the low of the 14th of July. Our short-term momentum studies detect negative momentum and magnify the case that USD/JPY could trade lower in the short run. The RSI turned down after finding resistance near its 50 line, while the MACD, already below its trigger line, has just obtained a negative sign. As for the broader trend, I still believe that the move above the downtrend line taken from the peak of the 5th of June is a sign that the longer-term uptrend is gearing up again. Therefore, I would expect any possible further setbacks to provide renewed buying opportunities.
• Support: 122.90 (S1), 122.00 (S2), 121.60 (S3)
• Resistance: 123.60 (R1), 124.15 (R2), 124.45 (R3)
Gold rebounds and hits 1100
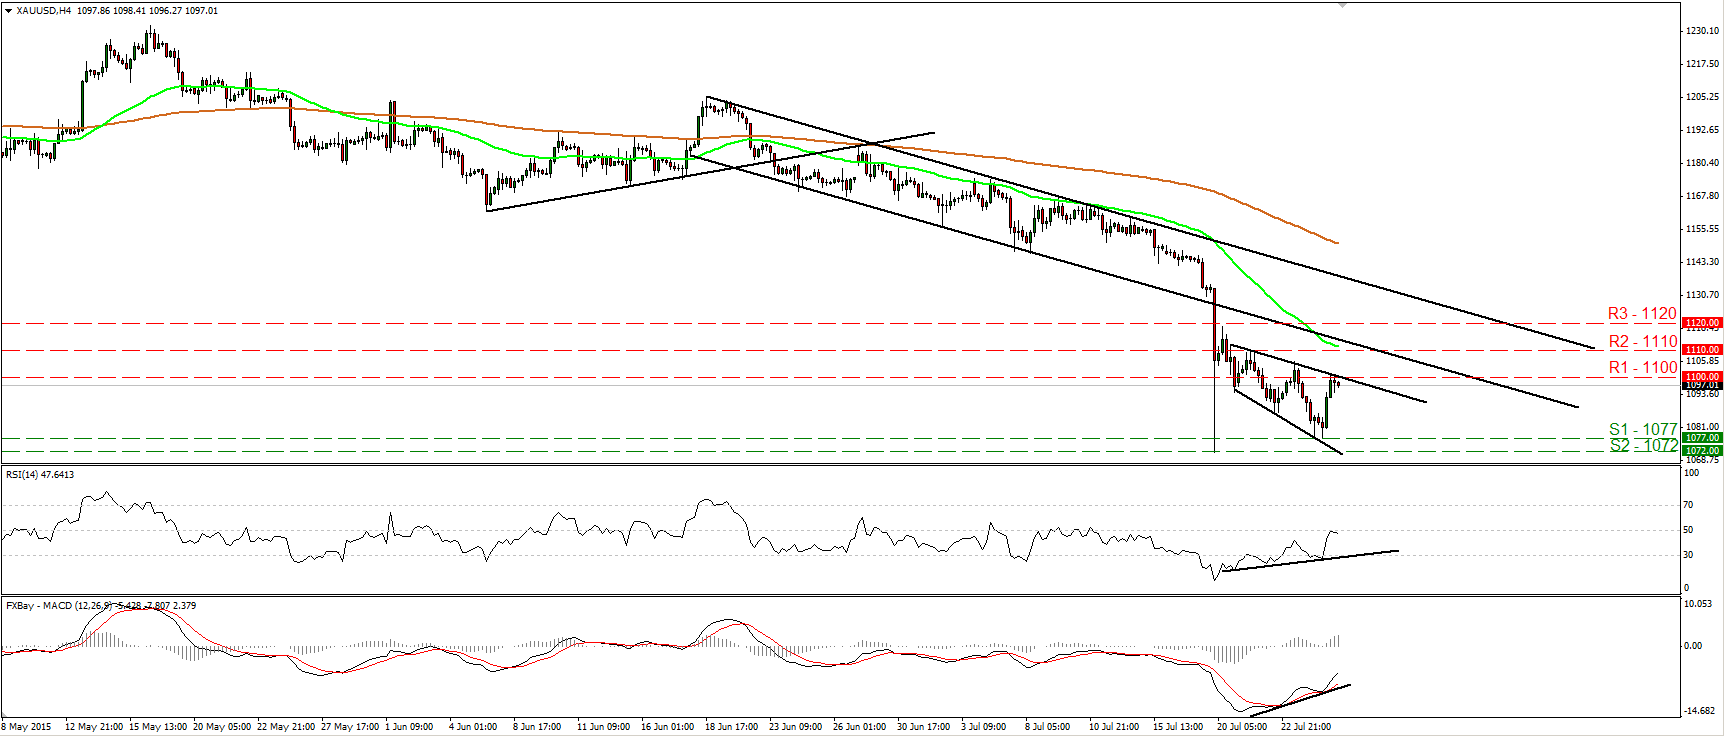
• Gold traded higher on Friday and hit resistance near the psychological level of 1100 (R1). As long as the metal is printing lower peaks and lower troughs below the lower line of the short-term downside channel that had been containing the price action from the 18th of June until Monday, I would consider the short-term outlook to remain negative. I would expect the bears to eventually take control again and aim for another test at the 1077 (S1) hurdle. Taking a look at our short-term momentum studies though, I would be careful of further rebound, perhaps towards the 1110 (R2) line. The RSI raced higher and hit resistance at its 50 line, while the MACD, although negative, has bottomed and crossed above its trigger line. Moreover, there is positive divergence between both these indicators and the price action. In the bigger picture, the plunge on the 20th of July triggered the continuation of the longer-term downtrend and kept the overall bias of the yellow metal to the downside, in my view.
• Support: 1077 (S1), 1072 (S2), 1060 (S3)
• Resistance: 1100 (R1), 1110 (R2), 1120 (R3)
WTI continues lower and finds support at 47.70
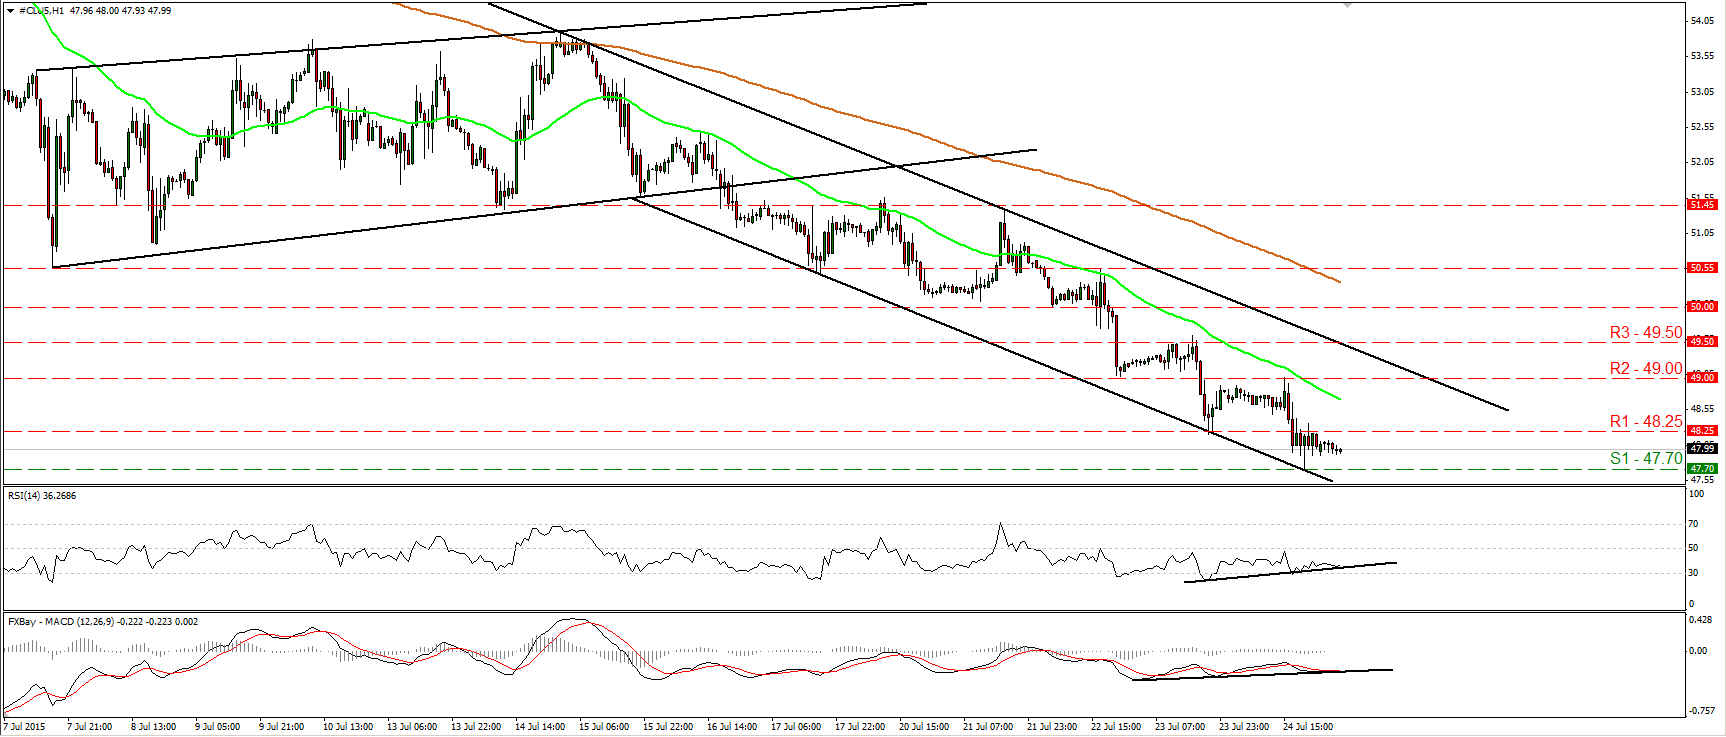
• WTI continued declining on Friday and hit support at 47.70 (S1). The price structure is still lower peaks and lower troughs, and therefore, the short-term picture remains negative in my view. I believe that a clear dip below the 47.70 (S1) barrier is likely to open the way for the 47.00 (S2) line, defined by the low of the 1st of April. However, given that I see positive divergence between both our hourly momentum indicators and the price action, I would be careful that an upside corrective bounce could be in the cards before the bears seize control again. A move above 48.25 (R1) would confirm the case and perhaps target the next resistance at 49.00 (R2). On the daily chart, I see that the medium-term trend is negative as well. Moreover, our daily oscillators detect strong downside speed and magnify the case for further declines. The 14-day RSI stays below its 30 line and points down, while the daily MACD stands below both its zero and signal lines, also pointing south.
• Support: 47.70 (S1), 47.00 (S2), 46.50 (S3)
• Resistance: 48.25 (R1) 49.00 (R2), 49.50 (R3)

