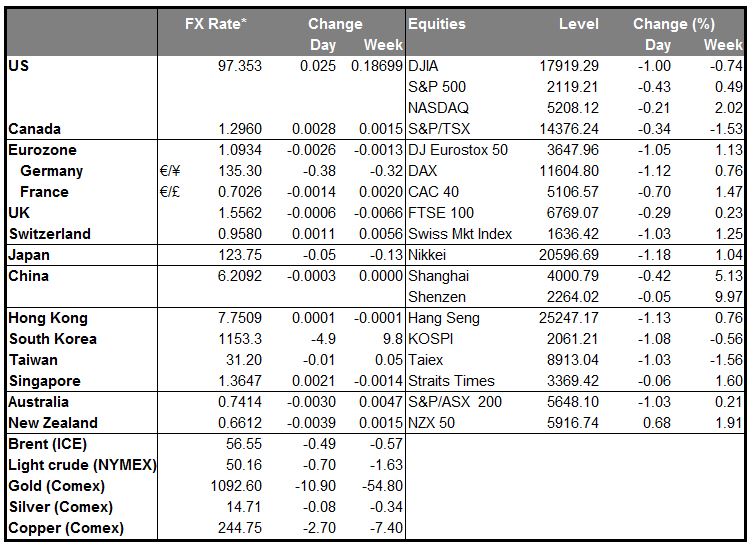
•Downward revision to US IP causes mean reversion A market never goes in a straight line. Yesterday, during New York time, many of the markets that have been trending recently reversed: equities were lower, bonds yields declined, gold and oil rallied, and the dollar fell. Fed fund rate expectations declined. However, the reversal partially reversed during Asian trading this morning, and oil and gold are both lower, as are most other commodities. Almost all equity markets are trading lower and USD remains far below its opening levels of Tuesday.
• The trigger for the move was weak annual revisions to the US industrial production (IP) report, which significantly revised the post-recession performance of the US manufacturing sector and left the current capacity utilization further below the long-run average. These annual revisions to the IP report usually aren’t market moving, but this time, the revision was enough to change investors’ thinking about the nature of the recent recovery and the amount of slack in the economy. IP, for the last six years since the recession ended, was revised down to annualized growth of 3.5% instead of 4.0%, and within that, oil drilling was much stronger and manufacturing much weaker than previously thought. For example, manufacturing output had been reported to have exceeded the 2007 peak in the middle of last year; now it’s known to be still 4% below the peak. Of particular importance for the dollar was the downward revision to capacity utilization: lower capacity utilization means less pressure on prices and less urgency to hike rates.
•Of course, weaker-than-expected manufacturing means even less-than-expected demand for commodities. Nonetheless the commodity currencies gained during US trading, although they began to weaken during the Asian trading day. I think the news is distinctly bearish for commodities and commodity currencies. It was bad enough that Chinese growth is slowing; if US manufacturing is also weak, then where will the support for commodities come from?
•Australian CPI mixed; headline below estimates Australia’s Q2 CPI came in mixed Wednesday. The closely watched trimmed mean was in line with estimates on a qoq basis and slightly higher than expected on a yoy basis, which initially send AUD higher, but the headline figure was lower than expected on both a qoq and yoy basis, and after some time, that seemed to win out and AUD moved lower. The fact that almost every commodity listed on Bloomberg is falling this morning may also have something to do with the weakness in AUD. Plus RBA Governor Glenn Stevens repeated previous comments that the question of further cuts in interest rates remains on the table.
•Self-defeating austerity: Endeavour Greece, a non-profit group that supports entrepreneurs, found that 58% of the 300 companies it surveyed between July 13 and July 17 reported a significant impact on their operations caused by the limitations imposed to cross-border transactions. Over two-thirds reported a significant drop in revenues. Most stunning, 23% are now planning to transfer their headquarters abroad for security, cashflow, and stability reasons. In this way, the restrictions on the banking sector are causing the economy to hollow out. This will only increase unemployment, decrease tax revenues and further increase the debt/GDP ratio.
•Today’s highlights: During the European day, the Bank of England releases the minutes of its July meeting. Even though the market consensus is for another 9-0 vote in favor of unchanged rates, the recent hawkish comments by BoE Governor Mark Carney that the time for the first rate hike is getting closer put some risk on this scenario. We will be watching to see if any of the MPC members who previously voted for a rate hike are likely to resume their hawkish stance any time soon, perhaps at the August meeting. Based on the commentary from Bank officials over the past month and the two successive months of a jump in wage growth, the hawks could be encouraged to dissent soon. If this is the case, we would expect GBP to resume its bullish trend, mainly against the commodity related currencies and EUR. The decision was “finely balanced” at the last two meetings, and it would be interesting to see if it remains so.
•In the US, existing home sales for June are forecast to have increased a bit. The housing starts and building permits released last week were consistent with an improving housing market. If the existing home sales are in line with a strong housing sector, this could keep confidence up and USD-supportive. The FHFA housing price index for May is also due out.
The Market
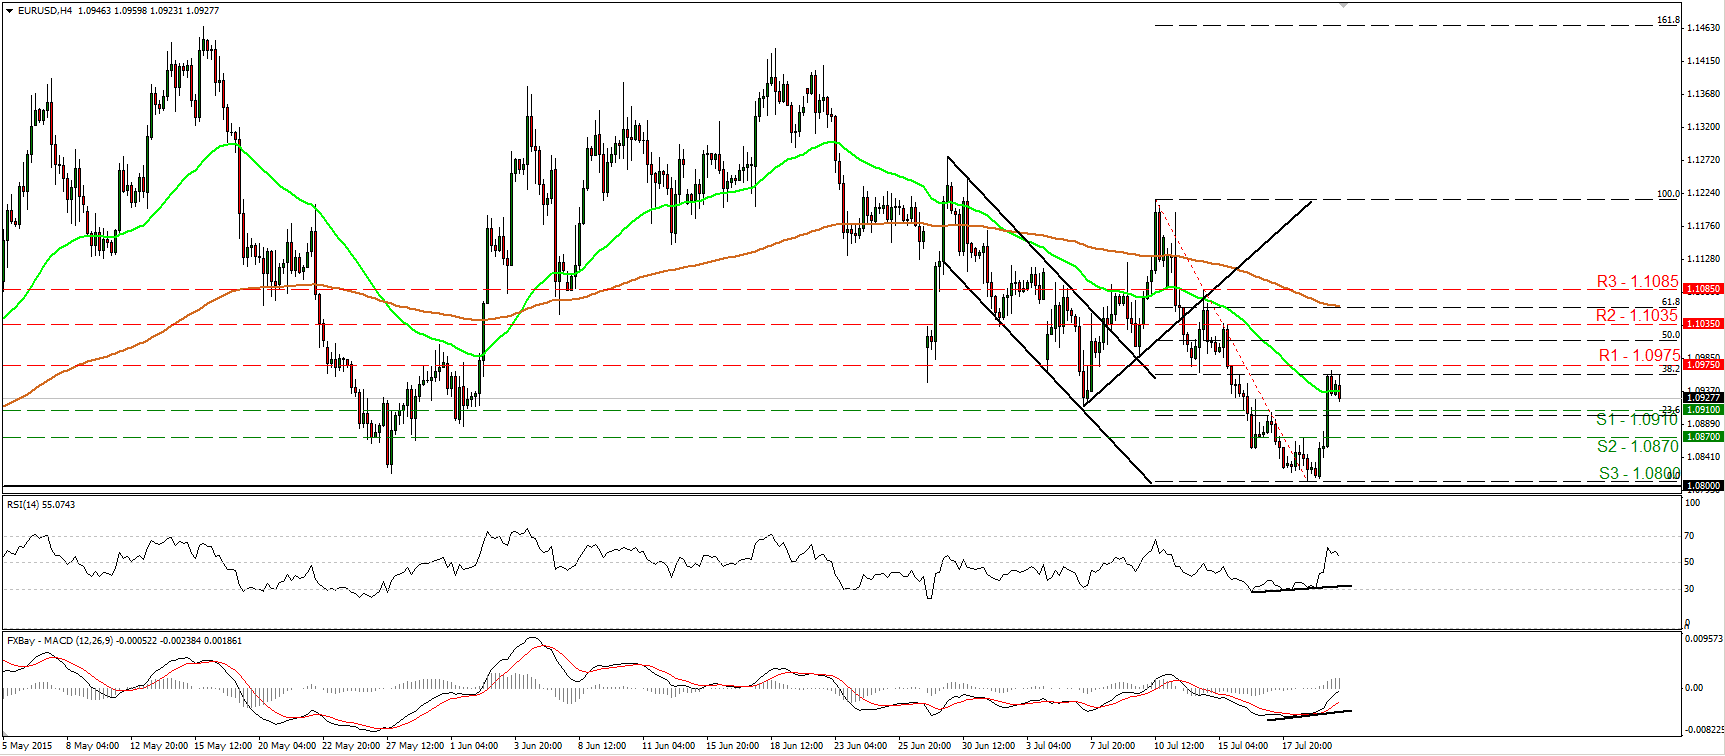
EUR/USD shoots up and stops fractionally below 1.0975
•EUR/USD shot up on Tuesday and hit resistance fractionally below the 1.0975 (R1) barrier, near the 38.2% retracement level of the 10th – 20th of July decline. Personally, I would treat yesterday’s rally as a corrective move and I would expect the forthcoming wave to be negative. A clear break below the 1.0910 (S1) line is likely to confirm the case and could initially target the next support of 1.0870 (S2). Looking at our short-term oscillators, I see that the RSI turned down and that it could be headed towards its 50 line again, while the MACD shows signs that it could start topping marginally below its zero line. As for the bigger picture, a daily close below 1.0800 (S3) would confirm a forthcoming lower low on the daily chart and perhaps turn the overall bias to the downside.
• Support: 1.0910 (S1), 1.0870 (S2), 1.0800 (S3)
• Resistance: 1.0975 (R1), 1.1035 (R2), 1.1085 (R3)
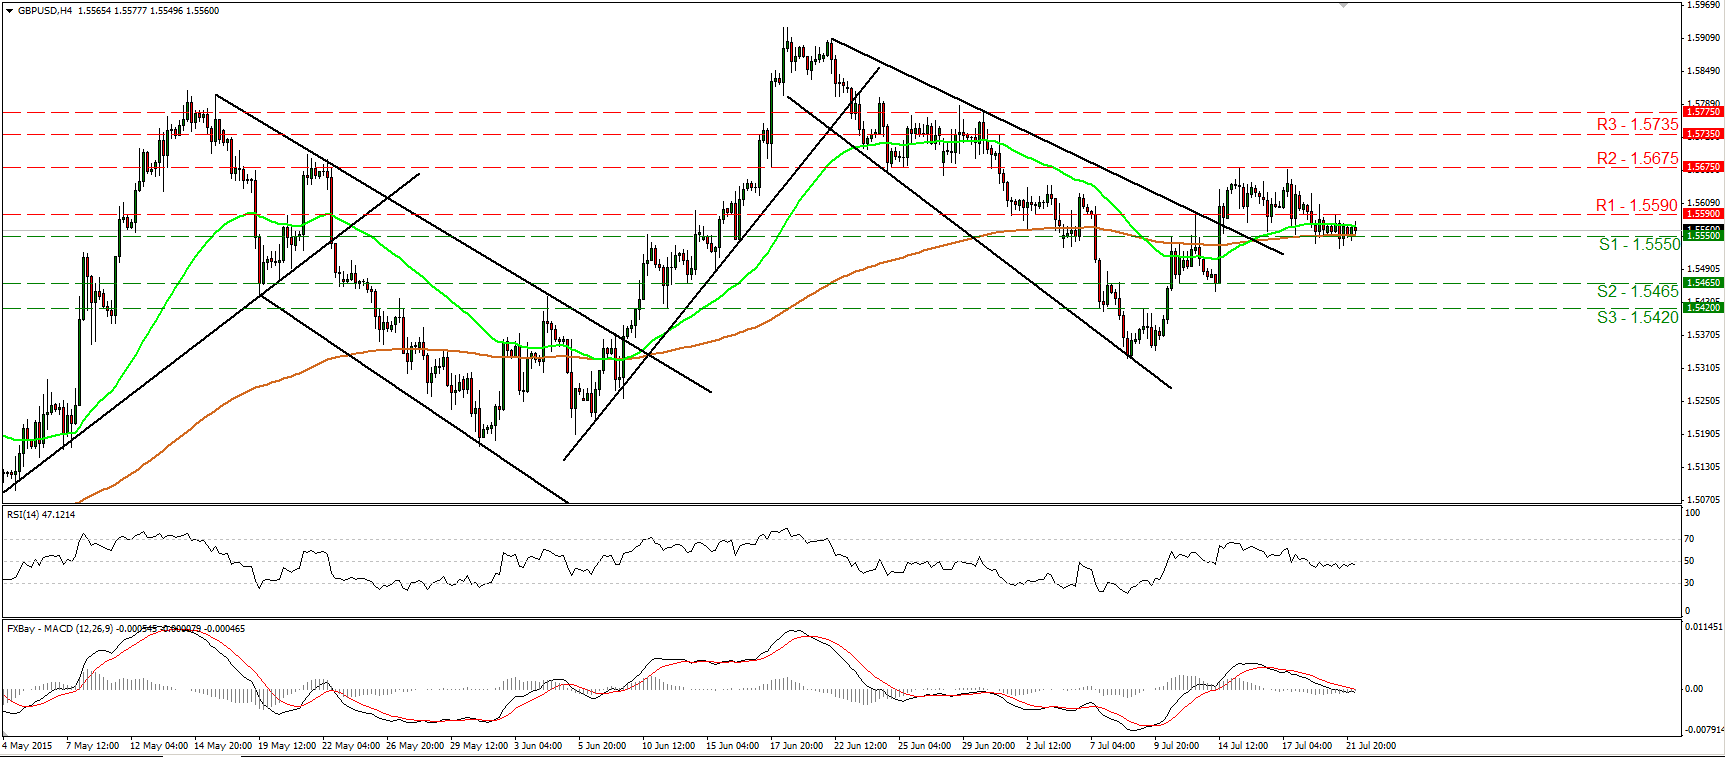
GBP/USD continues to consolidate
•GBP/USD continued trading sideways on Tuesday, staying between the support of 1.5550 (S1), which currently coincides with the 200-period moving average, and the resistance of 1.5590 (R1). Our short-term oscillators support the recent trendless mode as they both stand near their equilibrium lines. I still believe that we may experience a clear break below 1.5550 (S1) in the near term. Something like that could pave the way for 1.5465 (S2). Switching to the daily chart, I see that cable printed a higher low at around 1.5330, and that is still above the 80-day exponential moving average. As a result, I would consider the overall picture to stay somewhat positive, and I would treat any possible near-term declines as corrective moves, at least for now.
•Support: 1.5550 (S1), 1.5465 (S2), 1.5420 (S3)
•Resistance: 1.5590 (R1), 1.5675 (R2), 1.5735 (R3)
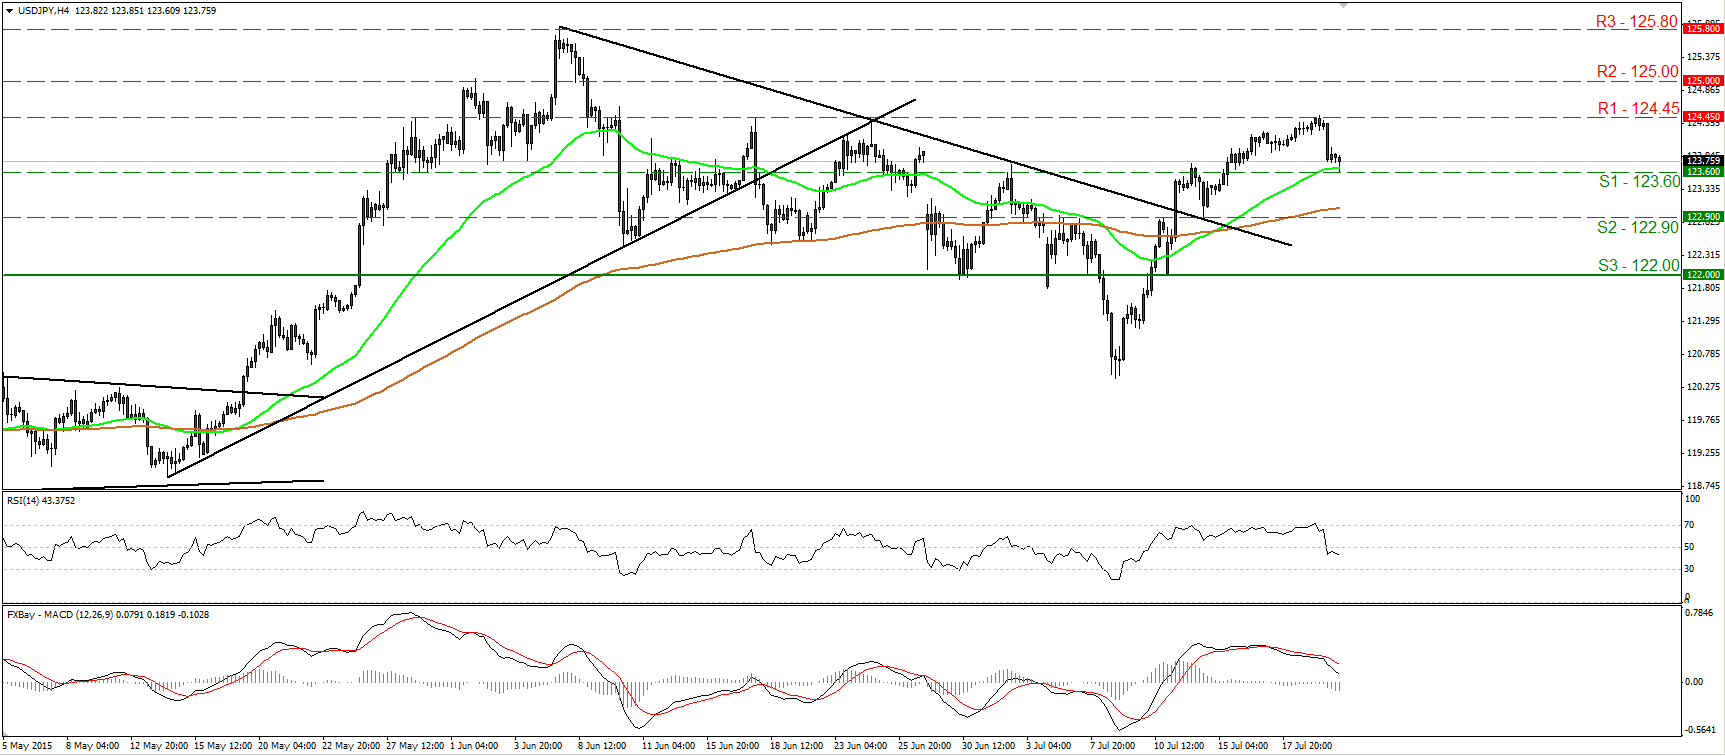
USD/JPY slides after hitting resistance at 124.45
•USD/JPY traded lower on Tuesday after it hit resistance at 124.45 (R1), but the decline was paused at 123.60 (S1). Taking a look at our momentum indicators, I see signs that the decline may continue for a while. The RSI fell back below its 50 line, while the MACD, although positive, stands below its signal line and is headed towards its zero line. A clear move below 123.60 (S1) is likely to reaffirm the case and perhaps open the way for our next support at 122.90 (S2). As for the broader trend, I still believe that the move above the downtrend line taken from the peak of the 5th of June is a sign that the longer-term uptrend is gearing up again. Therefore, I would expect any possible further setbacks to provide renewed buying opportunities.
• Support: 123.60 (S1), 122.90 (S2), 122.00 (S3)
• Resistance: 124.45 (R1), 125.00 (R2), 125.80 (R3)
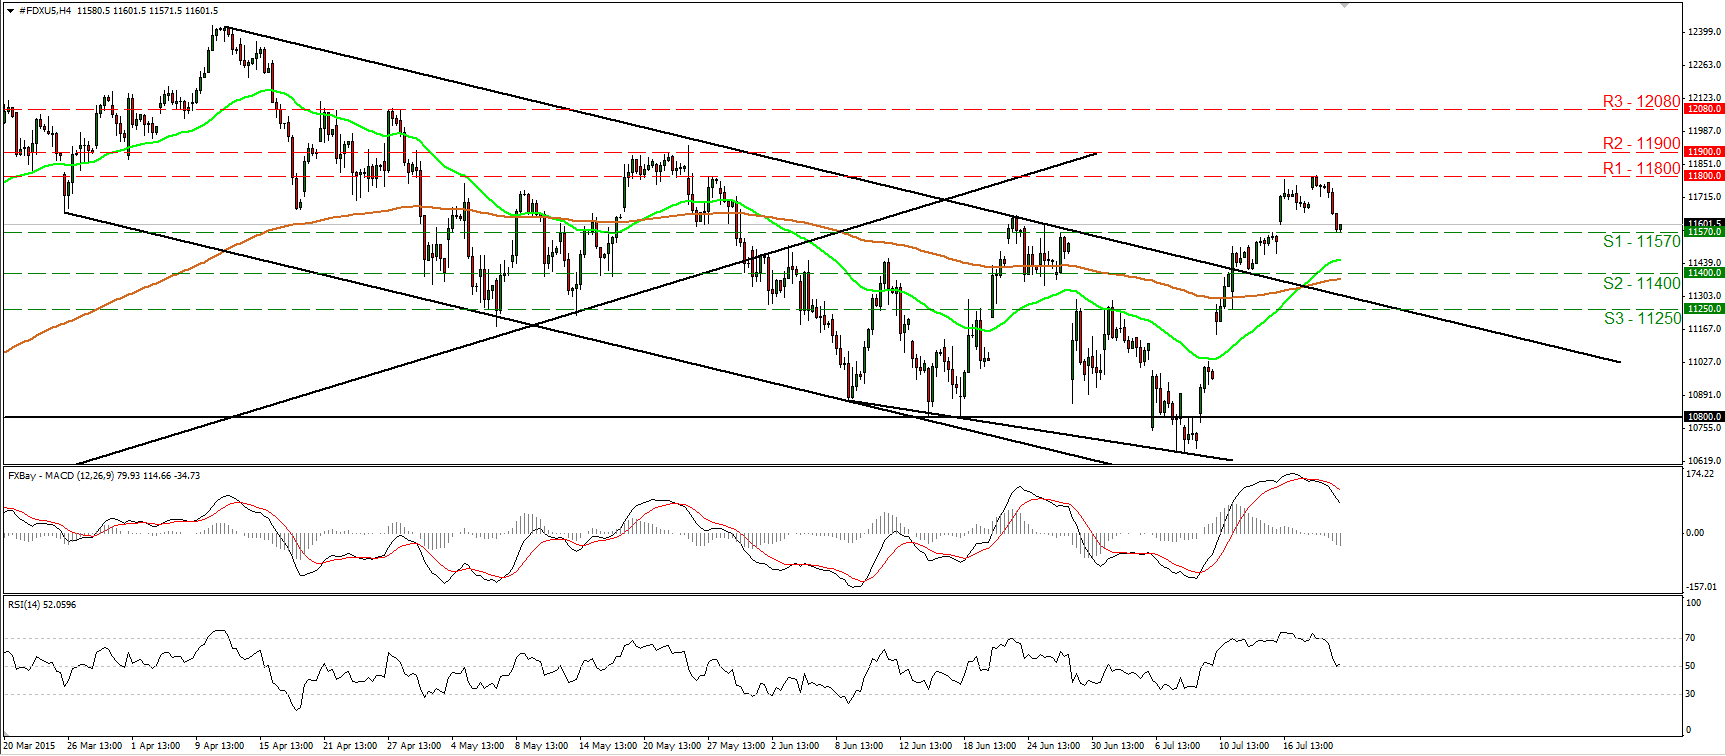
DAX futures tumble
•DAX futures tumbled yesterday after hitting resistance at the 11800 (R1) resistance territory. The decline was halted at 11570 (S1), but taking a look at our near-term momentum studies, I see signs that it could continue. The RSI is now testing its 50 line, while the MACD has topped and fallen below its trigger line. However, as long as the index is trading above the upper bound of the downside channel that had been containing the price action from the last days of March until the 10th of July, I would consider the outlook to stay somewhat positive. I would expect buyers to eventually take control again and to aim for another test at the 11800 (R1) zone. Plotting the daily chart, I see that the move out of the channel on the 13th of July is a first sign that the 10th of April – 8th of July decline was just a corrective phase of the prior uptrend. I would treat any further short-term setbacks as just temporary pullbacks.
• Support: 11570 (S1), 11400 (S2), 11250 (S3)
• Resistance: 11800 (R1) 11900 (R2), 12080 (R3)
Gold trades back below 1100
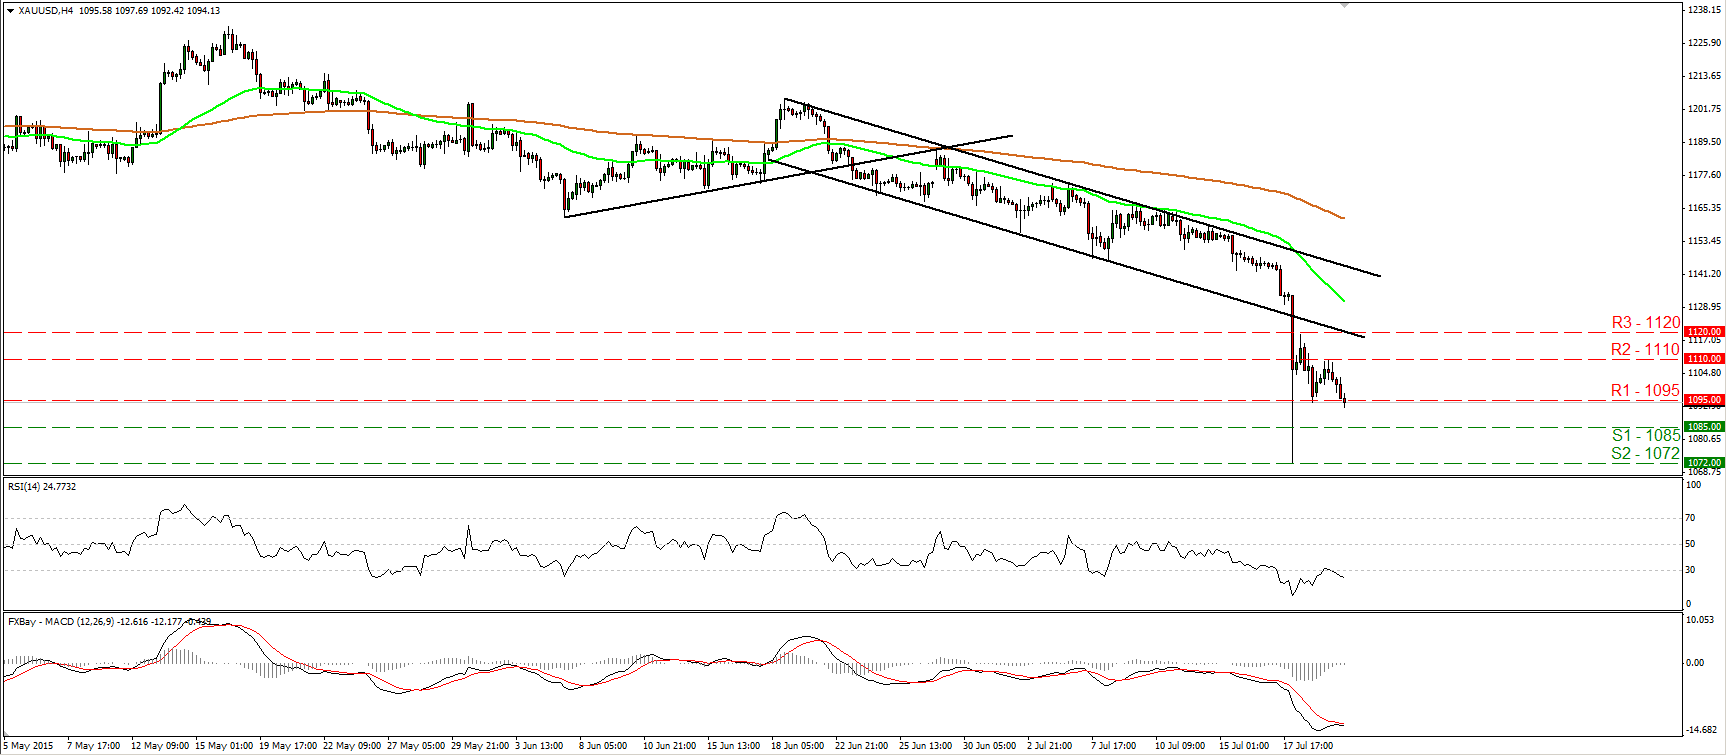
•Gold slid on Tuesday, after hitting resistance at 1110 (R2), and managed to break below the support (turned into resistance) of 1095 (R1). As long as the metal is trading below the lower line of the short-term downside channel that had been containing the price action from the 18th of June until yesterday, I would consider the short-term outlook to remain negative. I would expect the move below 1095 (R1) to initially target the 1085 (S2) line marked by the 24th and 25th of March 2010. Our short-term momentum studies detect strong downside speed and corroborate my view that further declines could be looming. The RSI is back below its 30 line, while the MACD, already negative, has turned down again near its signal line. In the bigger picture, Monday’s plunge triggered the continuation of the longer-term downtrend and kept the overall bias of the yellow metal to the downside.
• Support: 1085 (S1), 1072 (S2), 1060 (S3)
• Resistance: 1095 (R1), 1110 (R2), 1120 (R3)

