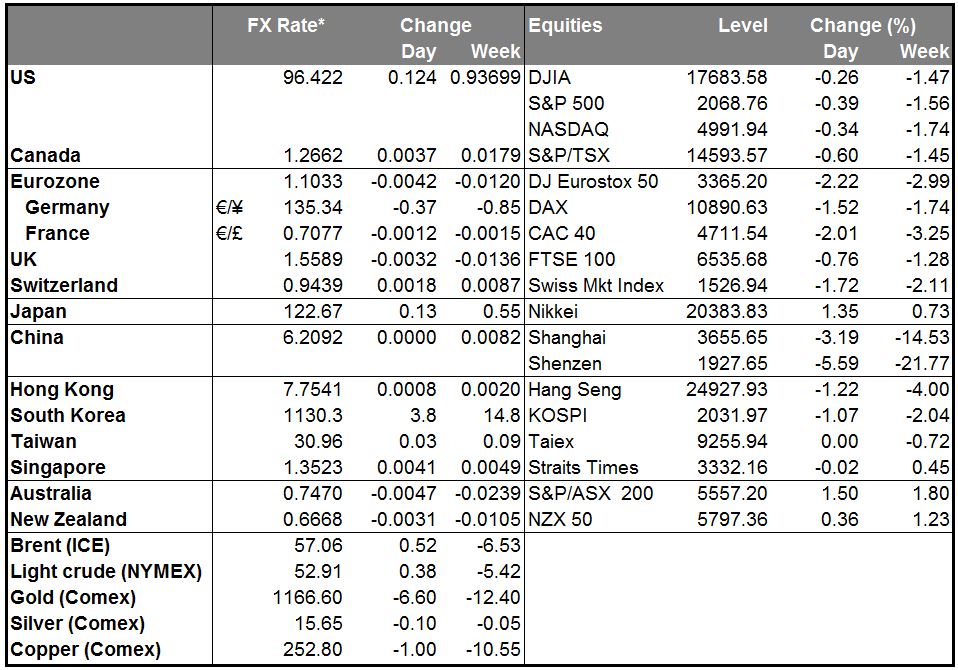
• Greece: confusion reigns Following the “no” decision in Sunday’s referendum, the confusion and disarray around Greece has only deepened. While Greek PM Tsipras said that a “no” vote would strengthen his hand in negotiations, the ECB tightened the screws on Greek banks by increasing the “haircut” on Greek government bonds pledged as collateral for the Emergency Liquidity Assistance (ELA), the ECB-supplied funds that are keeping Greece’s banks afloat. The cut reportedly reduces the remaining cash available to the Greek banks by two-thirds, meaning that they are all the closer to shutting down. The bank holiday was extended by two days in any case. The move was a surprise as most observers, including me, had thought that the ECB would take a strictly neutral stance and hold its policy steady until the political leaders made a decision at their meeting today. The move increases the pressure on Greece to reach a settlement at today’s meeting. The ECB meets again on Wednesday; if the Board increases the haircut again, then the Greek banks would apparently be unable to cover even the liquidity that they have already drawn, meaning that they would have to shut down.
• Greece’s new Finance Minister Euclid Tsakalotos and Prime Minister Alexis Tsipras will attend the meeting of EU leaders in Brussels today and propose a new deal based on the most recent set of proposals published by the European Commission. Most of the Greek political leaders yesterday signed a joint statement insisting that they want Greece to remain in the Eurozone. The problem, which I highlighted yesterday, is that the economy has deteriorated because of the turmoil and the capital controls, meaning that a larger fiscal adjustment is needed than before. But since the referendum gave the government a mandate only to reject the previous conditions, it makes it impossible for them to accept stricter conditions. At the same time, their counterparts are getting fed up. The Greek newspaper Kathimerini quoted sources in Brussels as saying that 16 of the other 18 Eurozone countries are in favor of letting Greece leave the Eurozone.
• EUR has remained fairly well supported, but if Greece does exit the Eurozone, I would expect to see it fall much further. JPY and CHF could be two of the major beneficiaries, as risk-off would probably grip the currency markets. The high-beta currencies on the other hand should be the ones to suffer, as risk aversion rises and commodity prices fall further.
• RBA keeps rates unchanged, as expected The statement from the Reserve Bank of Australia (RBA) following the meeting was virtually unchanged from the previous month, including the usual statement on the currency (“Further depreciation seems both likely and necessary, particularly given the significant declines in key commodity prices”) and the outlook for rates (we’ll watch the data). I expect that as commodity prices fall further and the economy struggles, the RBA will have to cut rates further later this year. That's likely to keep the currency under pressure.
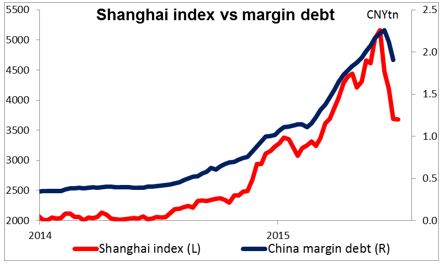
• While Greece grabbed all the attention, China was undergoing its own drama While Greece and its €316bn in debt captivated the attention of world markets, over $3tn or almost 10x as much money has evaporated from the Chinese stock market over the last three weeks or so. The Chinese government has announced several measures to shore up prices, including suspending IPOs, central bank support for margin-trade financing, and even stock purchases by state-run financial firms. And that’s only the direct aid – the indirect aid through macro policy changes include cuts in both interest rates and banks’ Reserve Ratio Requirements. Nonetheless, the measures provided only a brief fillip to the market before the downturn continued – the Shanghai index is off another 2.6% this morning and Shenzhen down 5.5%. While many people may say the market was a bubble to begin with – 4.4mn new stock trading accounts were opened the week of 29 May, after which the statistics were discontinued – and say “easy come, easy go,” the fact is that a crash like this is likely to dampen consumer confidence, not to mention restricting companies’ ability to reduce leverage by increasing their share capital. Moreover, the decline is being taken as a sign that perhaps the Chinese economy may be in worse shape than people had thought, although historically, there is little connection between growth and Chinese stock prices.
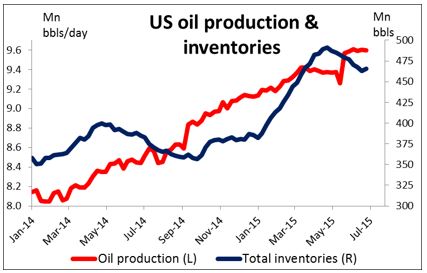
•Oil collapses on China, Greek problems, likely Iran deal Oil prices have been creeping lower recently, and finally broke out of their recent range on Friday. Apparently, investors had been waiting for a breakout one way or the other, because the move triggered a collapse yesterday. Some of the factors behind the collapse include: 1) China’s inability to restore confidence. A weak Chinese economy is bad for all commodity prices -- copper and nickel, the two metals that are most exposed to Chinese demand, were down sharply on Friday. 2) Iran talks seem to be progressing, although the negotiators keep missing deadlines. 3) Saudi Arabia cut its selling price to Asia. 4) Although US inventories may have fallen in the latest week, supplies remain high – US production is still at a record level despite the decline in the rig count. The fall in oil prices is more bad news for the commodity currencies – it’s no surprise that NOK and CAD were the two worst-performing G10 currencies, while RUB is also falling again. There’s probably more pain to come for these currencies.
• Today’s highlights: During the European day, investors' focus will be again on politics, as the EU leaders hold an emergency summit at which Greek PM Tsipras will present the country’s newest proposals. Ahead of the leaders’ summit, Eurozone finance ministers will meet as well, but it is not known what they will discuss. The new Greek finance minister, Euclid Tsakalotos, could divulge the new proposals earlier at the finance ministers meeting.
• As for indicators, German industrial production for May are due to be released.
• The UK industrial production for May is also coming out. Following the disappointing manufacturing PMI, expectations for a broad rebound in the nation’s growth in Q2 has lessened a bit. However, the rise in the construction PMI and service-sector PMI eased some of those concerns, and kept the rebound scenario alive. The forecast is for the monthly industrial production figure to fall, a turnaround from the previous month, while the annual rate is expected to accelerate. Overall, a strong positive surprise in industrial production is needed to keep the scenario for a rebound in Q2 alive and keep the UK on a recovery path.
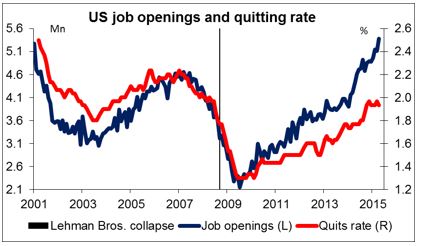
• In the US, only data of secondary importance are coming out. The Job Opening and Labor Turnover Survey (JOLTS) report for May is due out, and the forecast is for a moderate decline in the number of job openings. This survey will also bring the “quit rate,” a closely watched indicator of how strong the job market is. The US trade balance for May is also coming out.
The Market
EUR/USD headed towards 1.1000
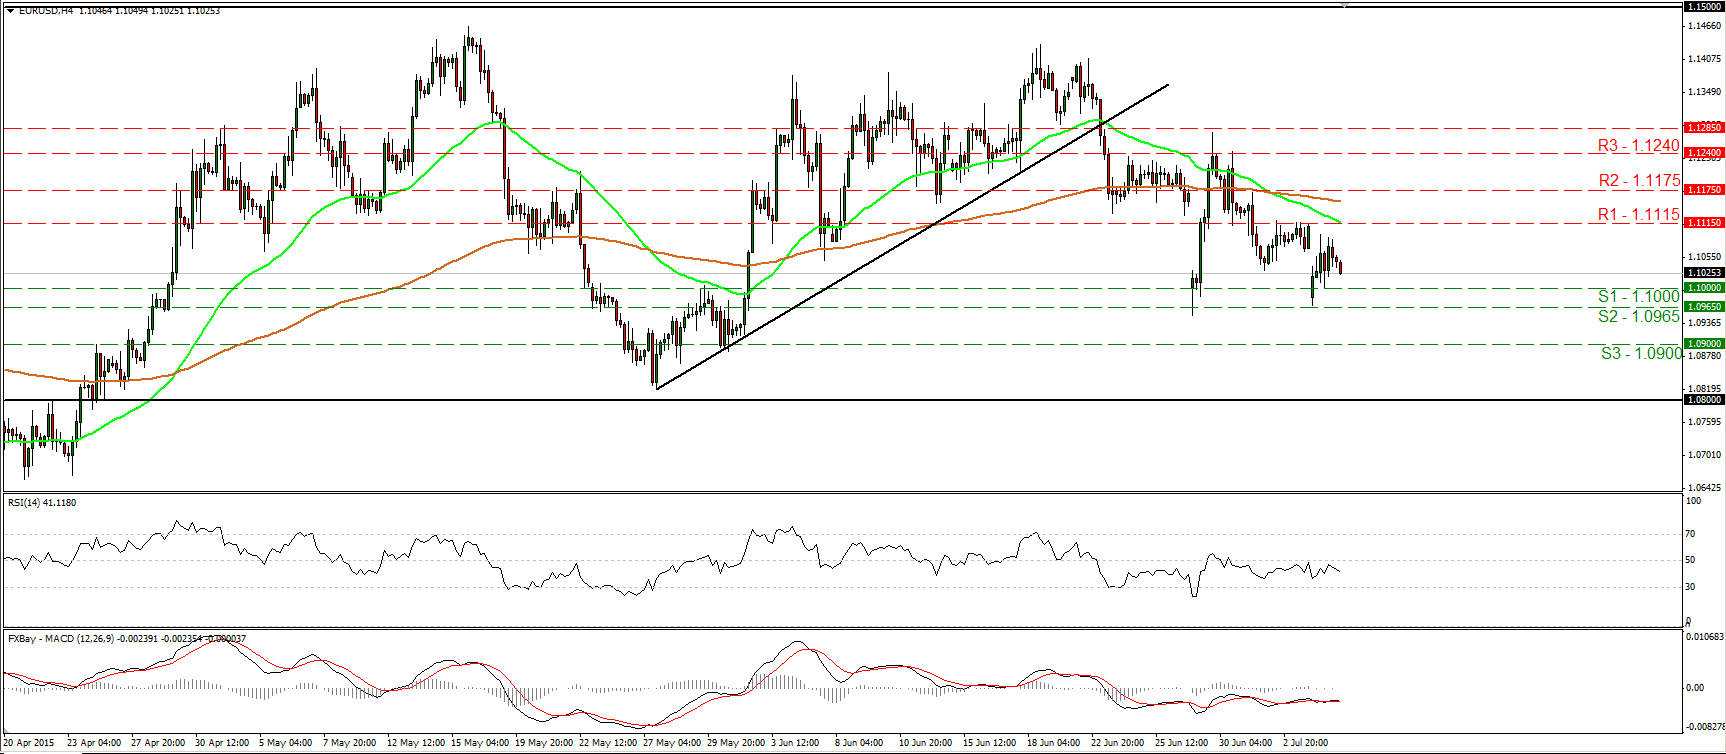
•EUR/USD recovered to fill most of the opening gap on Monday, but today during the Asian morning, it retreated again, and looks now to be headed towards the round figure of 1.1000 (S1). I still believe that the short-term outlook is somewhat negative, and therefore, I would expect a move below 1.1000 (S1) to initially challenge the 1.0965 (S2) barrier. A break below that hurdle would confirm a forthcoming lower low on the 4-hour chart, and is likely to open the way for our next support area of 1.0900 (S3). In the bigger picture, I would maintain my neutral stance. I believe that a move above the psychological zone of 1.1500 is the move that could carry larger bullish implications, while a break below 1.0800 is needed to confirm a forthcoming lower low on the daily chart and perhaps turn the overall bias back to the downside.
•Support: 1.1000 (S1), 1.0965 (S2), 1.0900 (S3)
•Resistance: 1.1115 (R1), 1.1175 (R2), 1.1240 (R3)
GBP/JPY recovers but hits resistance at 191.60
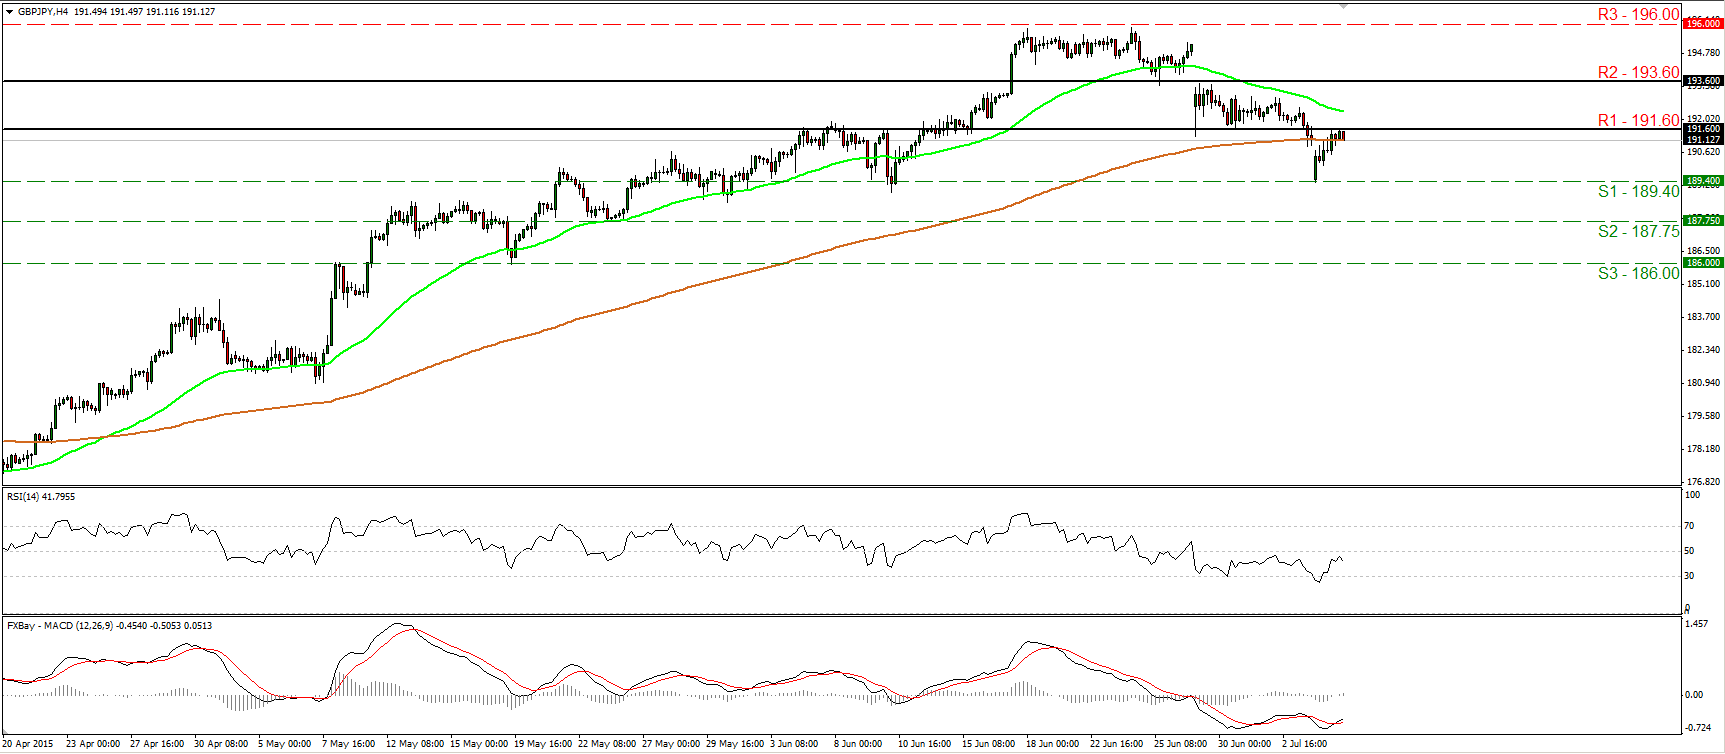
•GBP/JPY raced higher on Monday, but the advance was halted by the 191.60 (R1) barrier. In my opinion, the short-term outlook remains negative and I would treat yesterday’s recovery as a corrective move. I would expect sellers to take control around 191.60 (R1) and aim for another test at 189.40 (S1). A break below that support would confirm a forthcoming lower low on the 4-hour chart, and perhaps see scope for extensions towards the next support at 187.75 (S2). Today, the UK industrial production for May is coming out, and expectations are for a decline. This could encourage sellers to pull the trigger. On the daily chart, the pair has rebounded from near the 50-day moving average yesterday, and still trades well above the 200-day one. This supports that medium-term trend is positive, and as a result, I would treat any short term declines as a corrective move of that uptrend.
•Support: 189.40 (S1), 187.75 (S2), 186.00 (S3)
•Resistance: 191.60 (R1), 193.60 (R2), 196.00 (R3)
AUD/USD stays virtually unchanged following the RBA decision
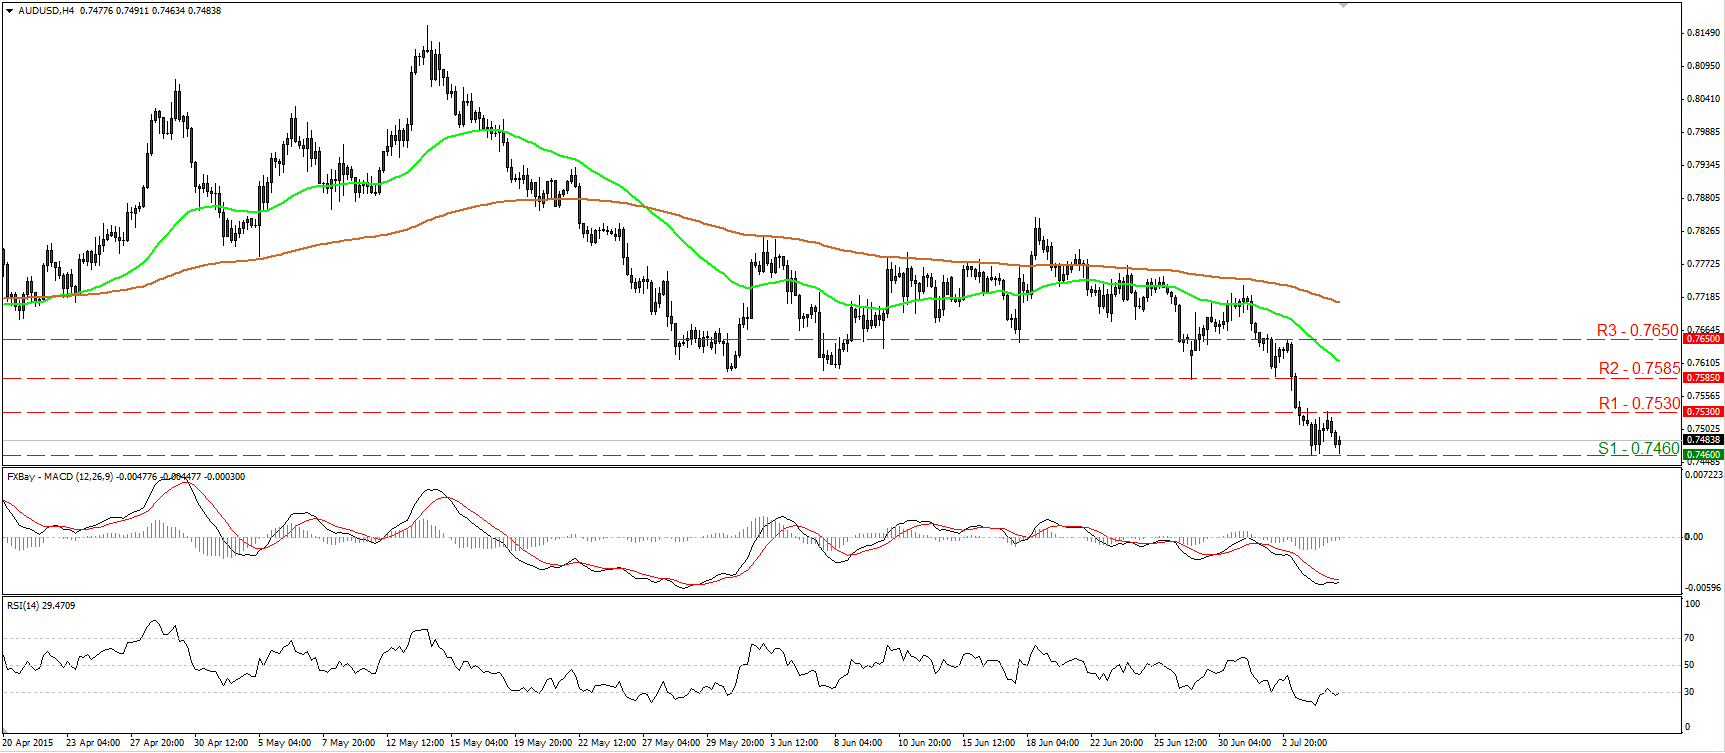
•AUD/USD slid on Monday, but the decline was limited slightly above the 0.7460 (S1) support. The RBA today decided to keep its benchmark interest rate unchanged at 2%. The decision was anticipated and AUD/USD traded virtually unchanged afterwards. Taking a look at our short-term oscillators, I see signs that a minor rebound could be in the works. The RSI looks able to exit its oversold territory, while the MACD has bottomed and could cross above its trigger line soon. However, the short-term trend is negative, thus I would expect the bears to eventually take control and drive the battle lower. A break below the 0.7460 (S1) line would confirm a forthcoming lower low on the 4-hour chart and perhaps set the stage for extensions towards the 0.7330 (S2) territory, determined by the low of the 6th of May 2009 and the inside swing highs of the 14th and 15th of April 2009. On the daily chart, the move below the psychological zone of 0.7500 signaled the continuation of the prevailing long-term downtrend, in my opinion.
•Support: 0.7460 (S1), 0.7330 (S2), 0.7250 (S3)
•Resistance: 0.7530 (R1), 0.7585 (R2), 0.7650 (R3)
DAX futures near 10800 again
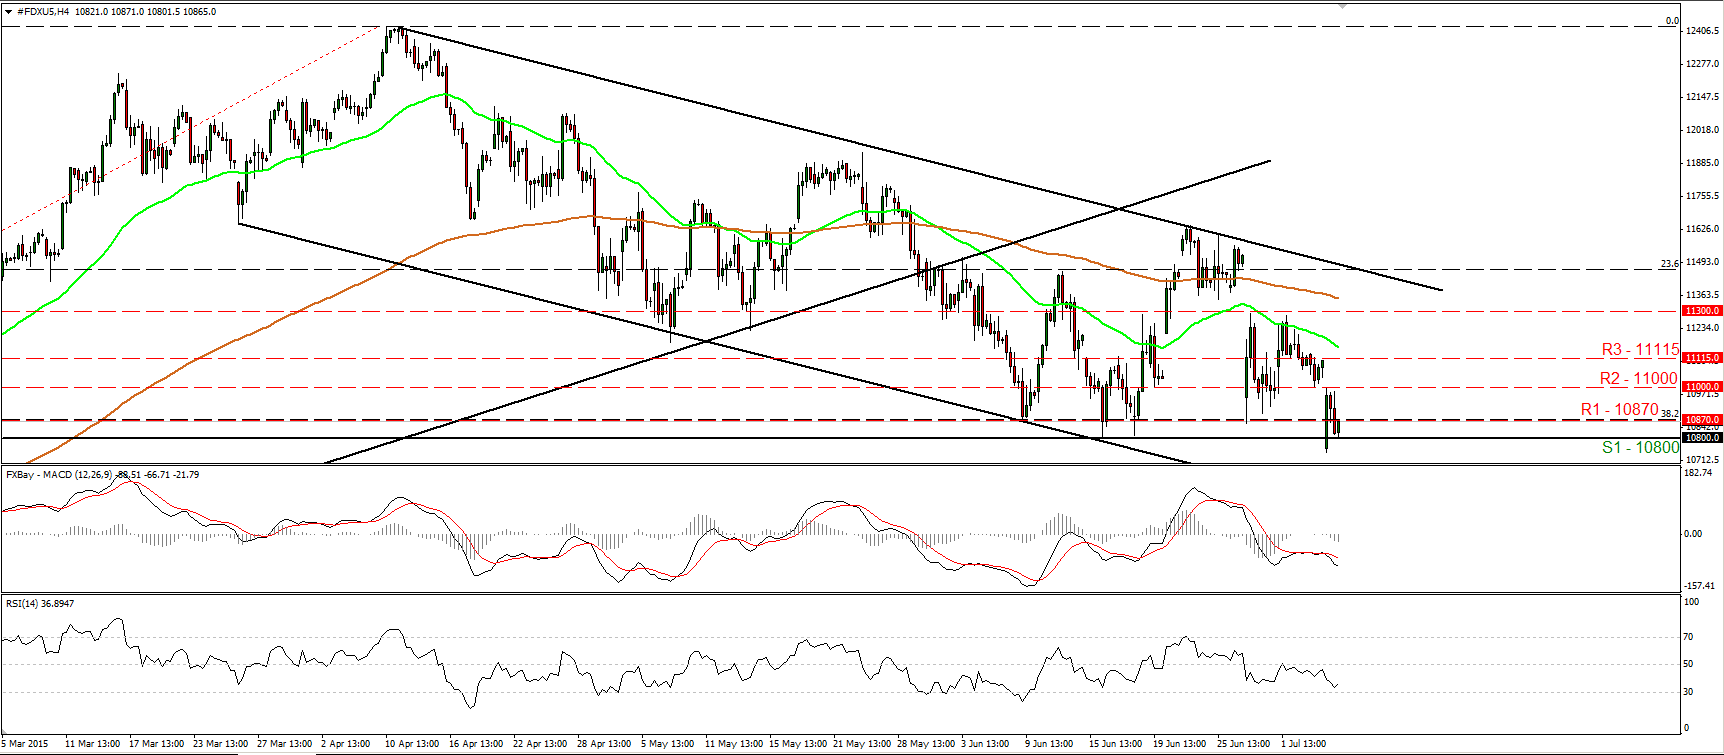
•DAX futures traded lower after hitting the key resistance line of 11000 (R2), and fell again below 10870 (R1), which happens to be the 38.2% retracement level of the 16th of October – 10th of April advance. However, the index hit support at the 10800 (S1) hurdle and then rebounded somewhat. Although DAX futures may continue to recover, perhaps for another test at the 11000 (R2) area, I would consider the outlook to remain negative. The index is trading below the longer-term uptrend line taken from the low of the 16th of October, and within the downside channel that has been containing the price action since the last days of March. I would expect sellers to eventually take control and aim for another dip below the 10800 (S1) hurdle. Such a move is likely to set the stage for extensions towards the 10600 (S2) territory, marked by the lows of the 9th and 10th of February.
•Support: 10800(S1), 10600 (S2), 10300 (S3)
•Resistance: 10870 (R1) 11000 (R2), 11115 (R3)
Gold hits resistance fractionally below 1175
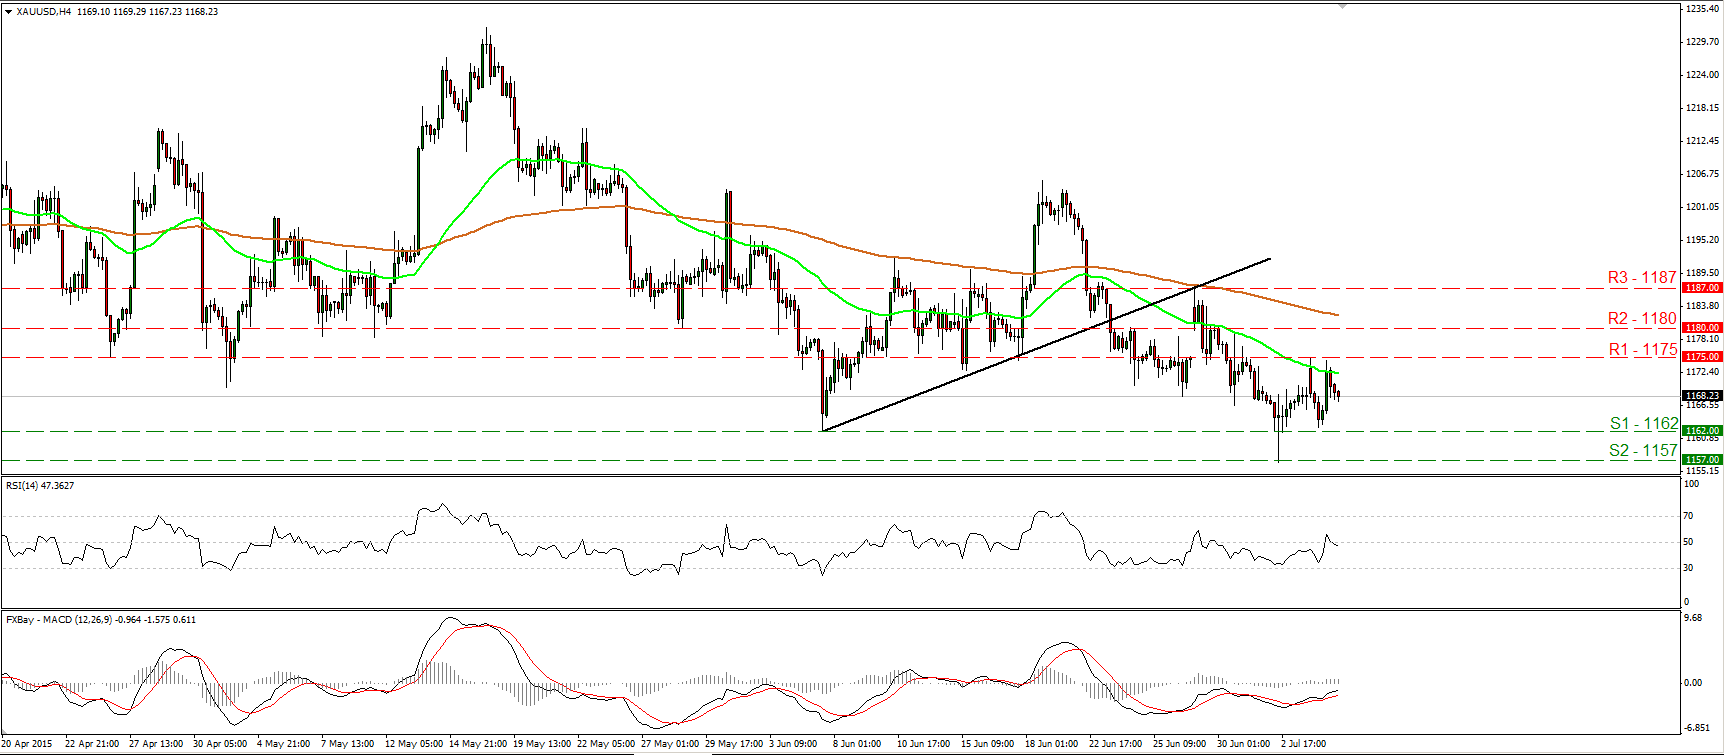
•Gold traded a bit lower on Monday morning, but it triggered some buy orders near the 1162 (S1) line and rebounded to hit resistance slightly below the 1175 (R1) barrier. Subsequently, the metal slid again. I still see a cautiously negative near-term outlook, thus I would expect the metal to continue and target again the 1162 (S1) zone. A break below that level could pave the way for the 1157 (S2) obstacle, defined by the low of the 2nd of July. On the daily chart, the move below the 1162 (S1) level on the 2nd of July confirmed a lower low on the daily chart and kept the overall outlook of gold cautiously negative. Our daily oscillators also support the case that the metal could trade lower, at least in the near term. The 14-day RSI stands below its 50 line and points down, while the daily MACD lies below both its zero and signal lines.
•Support: 1162 (S1), 1157 (S2), 1153 (S3)
•Resistance: 1170 (R1), 1175 (R2), 1180 (R3)

