•The last try fails Greece made a last-ditch effort to secure more funding before its current program ran out, but was basically told that it would be impossible unless it cancelled the referendum. It all came to nothing and the country failed to deliver the money it owed to the IMF, which quickly declared Greece to be “in arrears.” That declaration gives the European Financial Stability Fund (EFSF) the right to demand immediate repayment of their EUR 142bn in loans to Greece if they want to. Failure to repay those loans on demand would trigger all sorts of cross-defaults and might make it impossible for the ECB to continue to support the banking system. In other words, the collapse of the government’s finances and the banking system. So far, the indications are that the EFSF will not pull the trigger at least until after the referendum. The possibility of them sending the country into bankruptcy does increase the pressure on Greece.
• ECB Board member Ewald Nowotny said that July 20th, when Greece must pay the ECB EUR 3.5bn, is “probably the most important date.” “…(H)ow can a country which has no access to the ECB continue its activities?” he asked, indicating that if Greece votes “no” on the referendum and therefore fails to get a new funding package, it will not be able to repay the ECB and the ECB will have no choice but to cut off its Emergency Liquidity Assistance (ELA). That would mean that the banks would become insolvent and have to close.
• Conclusion: it all comes down to the referendum on Sunday So the last door slammed shut, and now there’s nothing to do but to wait for the results of the referendum on Sunday. The indications are that the result may be finely balanced. Older people who have pensions and remember what life was like before Greece joined the EU are said to be leaning towards voting “yes,” while younger people with no savings, no job, no future and nothing to lose think that a “yes” vote will at least give them hope. It’s likely to be close. After seeing the results of the UK election, I wouldn’t place too much confidence in polls.
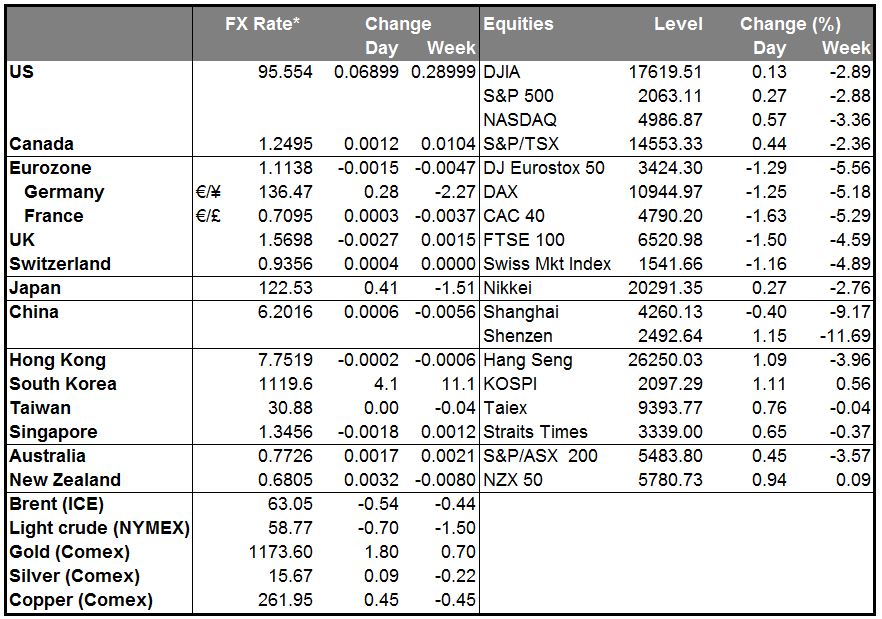
• Tankan beats expectations, but Greece seems more important The Bank of Japan’s quarterly Tankan business confidence survey for Q2 was much better than expected, at least for large companies, but the muted response in the stock market (up only about 0.25% in early afternoon Tokyo trading) suggests that events in Greece are just as important to investors in Japan as the domestic economy. Moreover, other signs of activity suggest that the Japanese economy probably slowed or even contracted in Q2. USD/JPY was slightly higher this morning but nothing significant. Although I remain long-term bullish on the pair, I would be cautious about going long USD/JPY at this point, because I think there could be a “flight to safety” that would push it down if the situation with Greece gets uglier.
• Australian building approvals for May were much better than expected, nearly double the mom rise that the market was forecasting. It’s not clear though whether that was the reason why AUD was the best performing G10 currency over the last 24 hours. In fact, AUD/USD seems to have tracked Japanese stocks fairly closely – perhaps a risk-on play? China’s final manufacturing PMIs for June, both the official and HSBC versions, were revised down from the initial estimates, so that didn’t help. Meanwhile iron ore prices fell below USD60 a ton for the first time in five weeks – although that was because of an estimate that shipments from Australia will rise 10% next year. Perhaps investors feel that the increase in volume will make up for the fall in prices. I think the rally is overdone, given all the problems in China, and would expect AUD to fall back today.
• CAD weakened the most of any of the G10 currencies despite another rise in oil prices, after the April GDP figure showed the fourth consecutive monthly contraction in activity. GDP was down 0.1% mom instead of rising 0.1% as expected. Not only did oil and gas and other natural resources activity fall for the sixth consecutive month, but also non-energy exports and consumer spending have failed to show the strength that the Bank of Canada was counting on to take over as drivers of growth. USD/CAD is now challenging the recent highs of end-May/early June (1.2563 on June 1st) and could meet some resistance.
• Today’s highlights: Weekly ECB meeting The weekly ECB meeting will as usual reconsider the Emergency Liquidity Assistance (ELA) that it supplies to Greek banks. It should continue the money, but the fact that the country defaulted to the IMF may change things – perhaps make the ECB demand more collateral. That would put additional pressure on the government by reducing even further the amount of money available to the public. The effort could backfire, however. Articles I’ve read suggest that Greeks blame the European authorities, not their own government, for the inconvenience of having to line up for limited amounts of money every day and that the humiliation is making them more determined to vote “no” on the referendum in order to demonstrate their independence.
• During the European day, we get the final manufacturing PMI figures for June from several European countries, and the Eurozone as a whole. As usual, the final forecasts are the same as the initial estimates, thus the market reaction on these news is usually limited, unless we have a huge revision from the preliminary figures.
• UK manufacturing PMI for June is forecast to increase a bit, which could prove GBP-positive. In addition, Bank of England Governor Mark Carney presents the Bank’s semi-annual assessment of financial stability risks. Since the December report, the central bank has highlighted market-liquidity risks and the weakening global economic outlook.
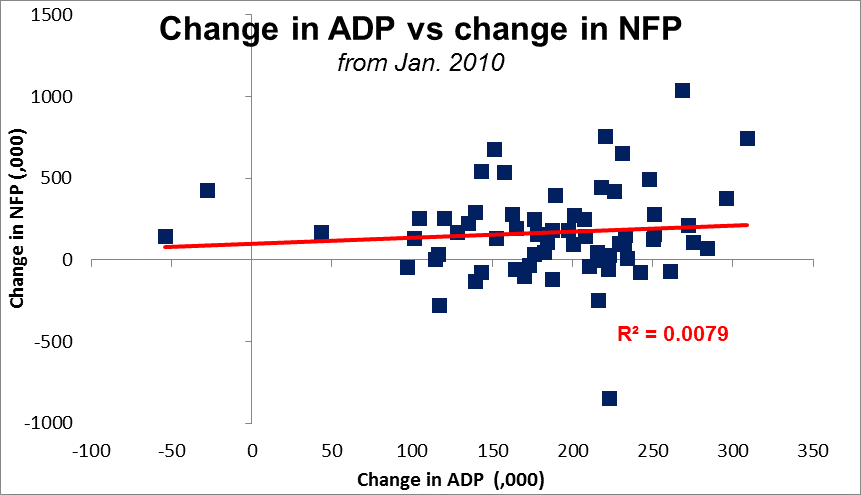
• In the US, the ADP employment report for June is coming out, this time only one day ahead of the nonfarm payroll release, as US markets will be closed Friday due to the US Independence Day holiday on Saturday. The ADP report is expected to show that the private sector gained more jobs in June than it did in the previous month. That would increase expectations of a strong nonfarm payroll figure as well and boost the dollar, although in fact the correlation between the two indicators is not particularly wonderful. The final Markit manufacturing PMI and the ISM manufacturing PMI both for June are also due out.
The Market
EUR/USD finds support near 1.1115
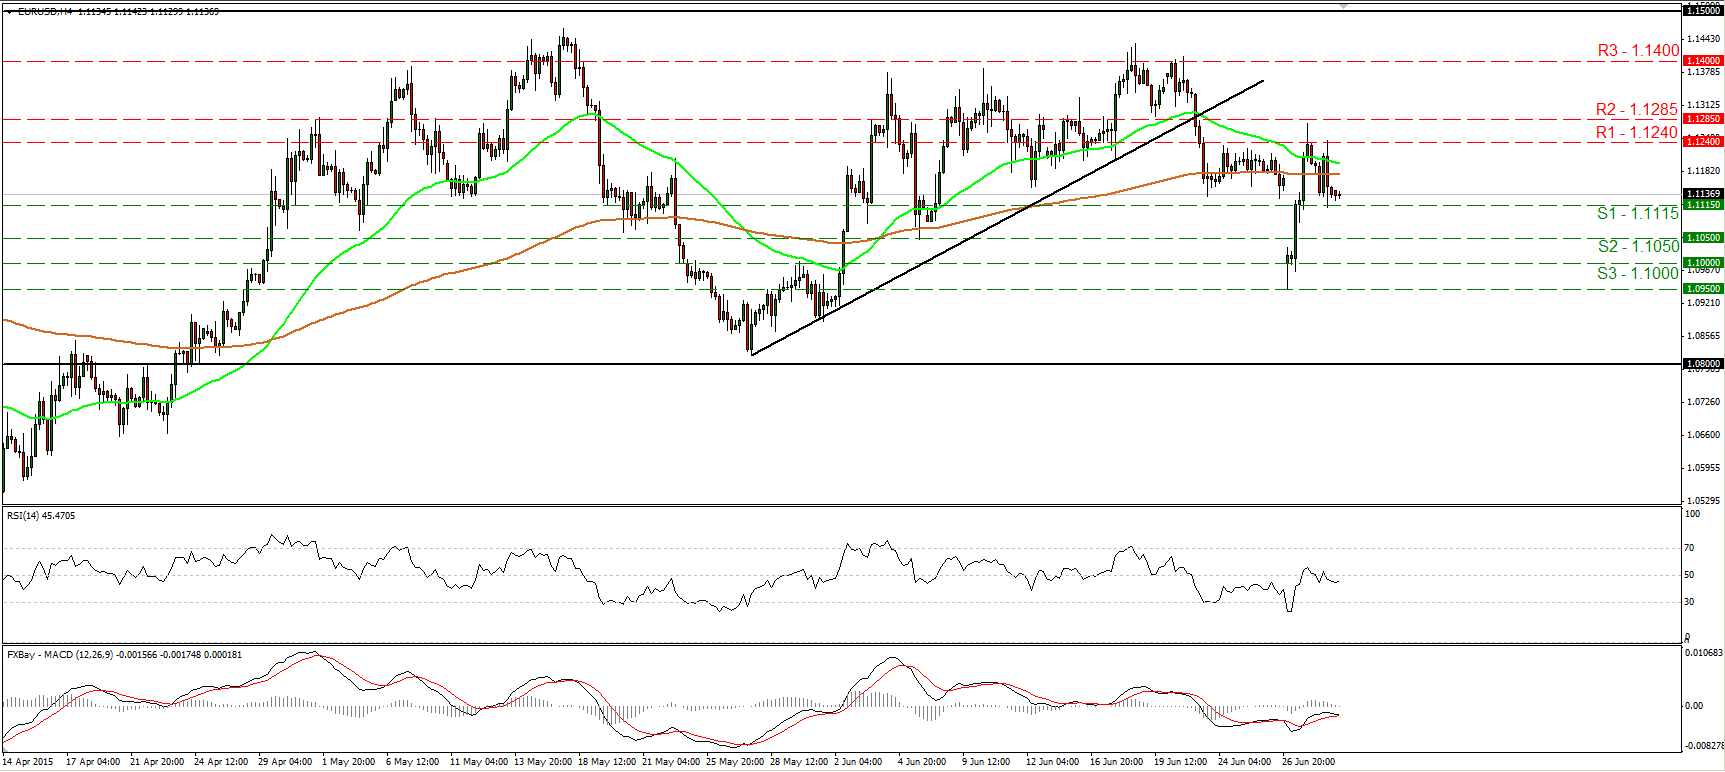
• EUR/USD traded lower on Tuesday to hit support at around 1.1115 (S1). During the European morning Wednesday, the rate stands marginally above that barrier. If it manages to fall below it, I would expect a test at our next support hurdle of 1.1050 (S2). Today, the US ADP employment report is expected to show that the private sector gained more jobs in June than in May. This could be the catalyst for the aforementioned bearish move. Our short-term oscillators detect negative momentum and support the case that the forthcoming wave is likely to be negative. The RSI fell below its 50 line, while the MACD, already negative, has topped and could fall below its trigger line soon. In the bigger picture, I would maintain my neutral stance. I believe that a move above the psychological zone of 1.1500 is the move that could carry larger bullish implications, while a break below 1.0800 is needed to confirm a forthcoming lower low on the daily chart and perhaps turn the overall bias back to the downside.
• Support: 1.1115 (S1), 1.1050 (S2), 1.1000 (S3)
• Resistance: 1.1240 (R1), 1.1285 (R2), 1.1400 (R3)
GBP/USD trades in sideways mode
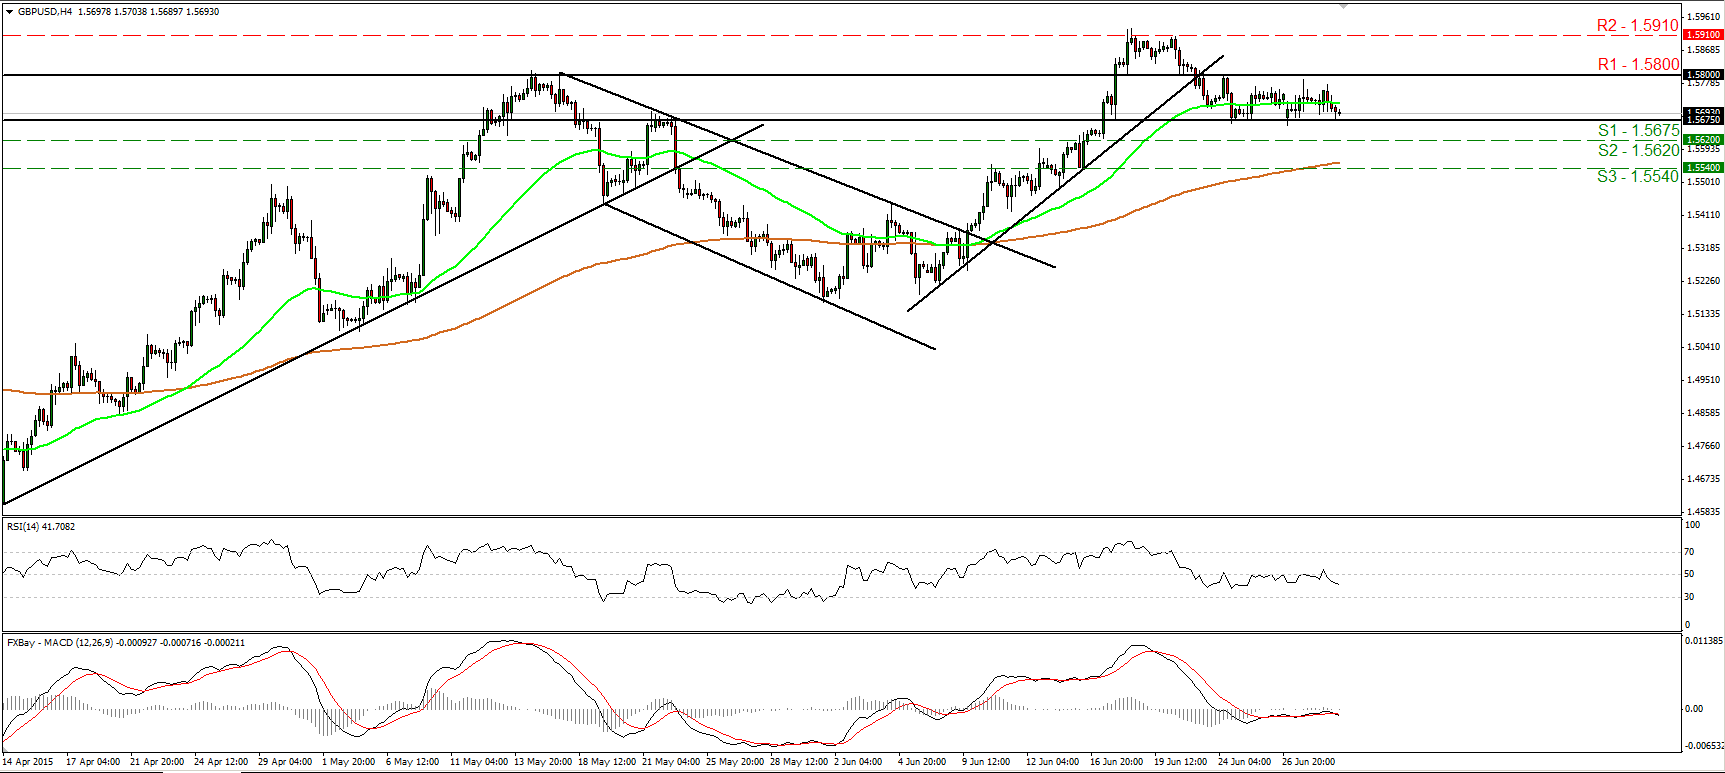
• GBP/USD continued trading in a sideways mode on Tuesday, remaining trapped between the support of 1.5675 (S1) and the resistance of 1.5800 (R1). Today, the UK manufacturing PMI for June is forecast to increase, something that could cause the rate to rebound from the lower bound of the range. Nevertheless, even if the next leg is positive, I prefer to see a break out of the aforementioned trading range before I get confident on the forthcoming short-term direction. Therefore, I would see a flat near-term picture for now. Our momentum studies corroborate my view. Both the RSI and the MACD have been oscillating around their equilibrium lines. Switching to the daily chart, I see negative divergence between both the daily oscillators and the price action. Therefore, it is possible to see the pair exiting the short-term range to the downside in the not-too-distant future. However, as long as cable is printing higher peaks and higher troughs above the 80-day exponential moving average, I would see a positive medium-term picture. As a result, I would treat any possible future declines as a corrective phase.
• Support: 1.5675 (S1), 1.5620 (S2), 1.5540 (S3)
• Resistance: 1.5800 (R1), 1.5910 (R2), 1.6000 (R3)
EUR/JPY hits resistance at 138.00 and declines
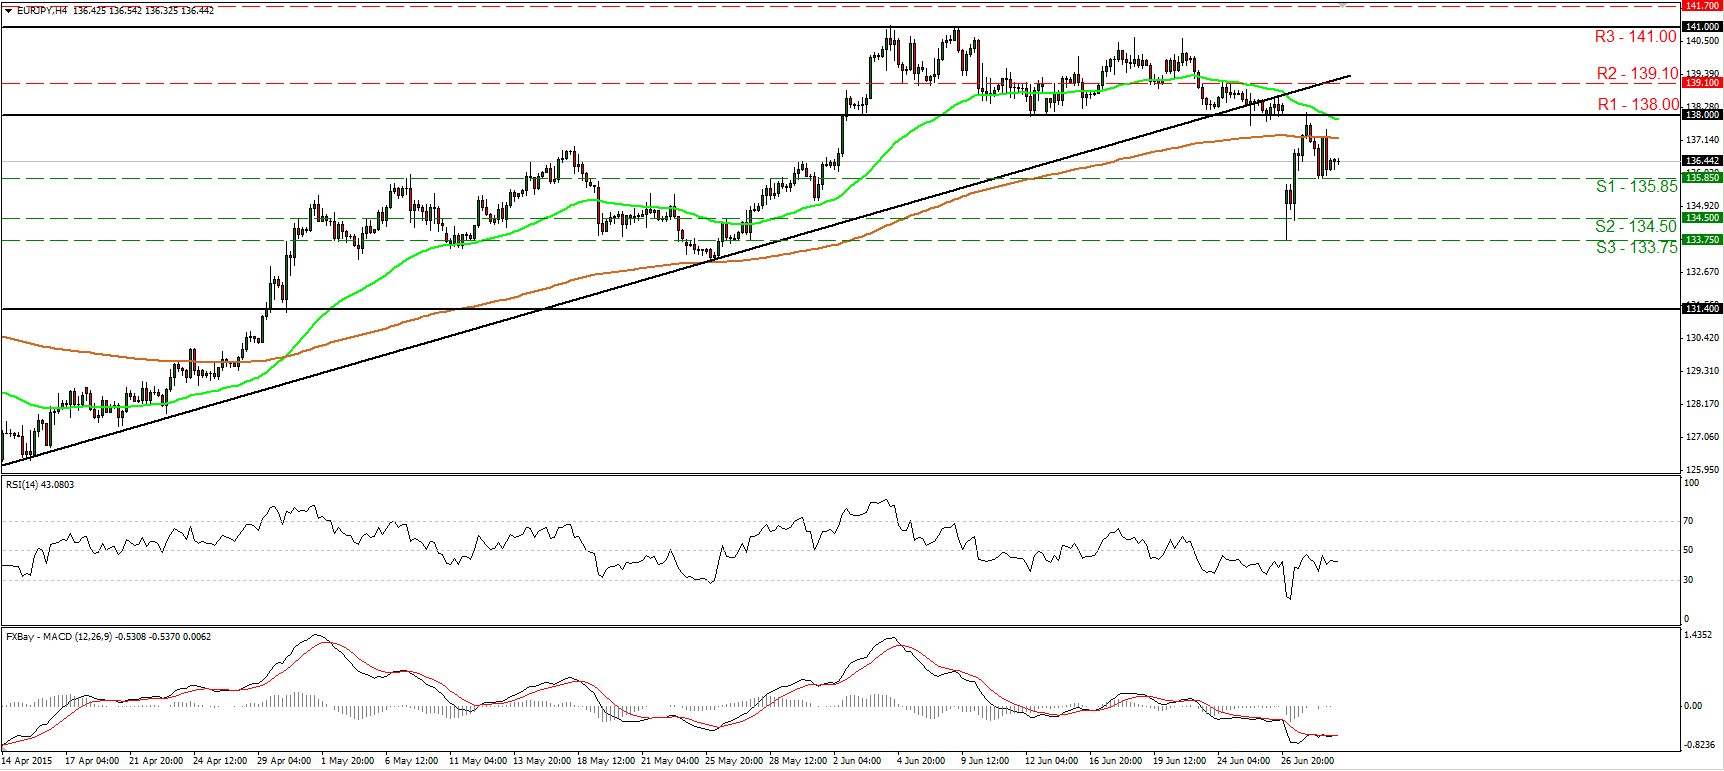
• EUR/JPY raced lower after hitting resistance at 138.00 (R1), the lower bound of the sideways range it had been trading in from the 2nd of June until Monday. The decline was halted near 135.85 (S1) and subsequently the rate rebounded somewhat. Taking into account that EUR/JPY exited the aforementioned sideways path to the downside, and that it is trading below the uptrend line taken from the low of the 14th of April, I would consider the near-term outlook to be negative. A break below 135.85 (S1) is likely to open the way for another test at 134.50 (S2). On the daily chart, the rate hit support at 133.75 (S3) on Monday, which stands pretty close to the 50% retracement level of the 14th of April – 4th of June advance. I would like to see a daily close below that area before I assume that the medium-term picture has turned negative as well.
• Support: 135.85 (S1), 134.50 (S2), 133.75 (S3)
• Resistance: 138.00 (R1), 139.10 (R2), 141.00 (R3)
DAX futures trade slightly above the key zone of 10870
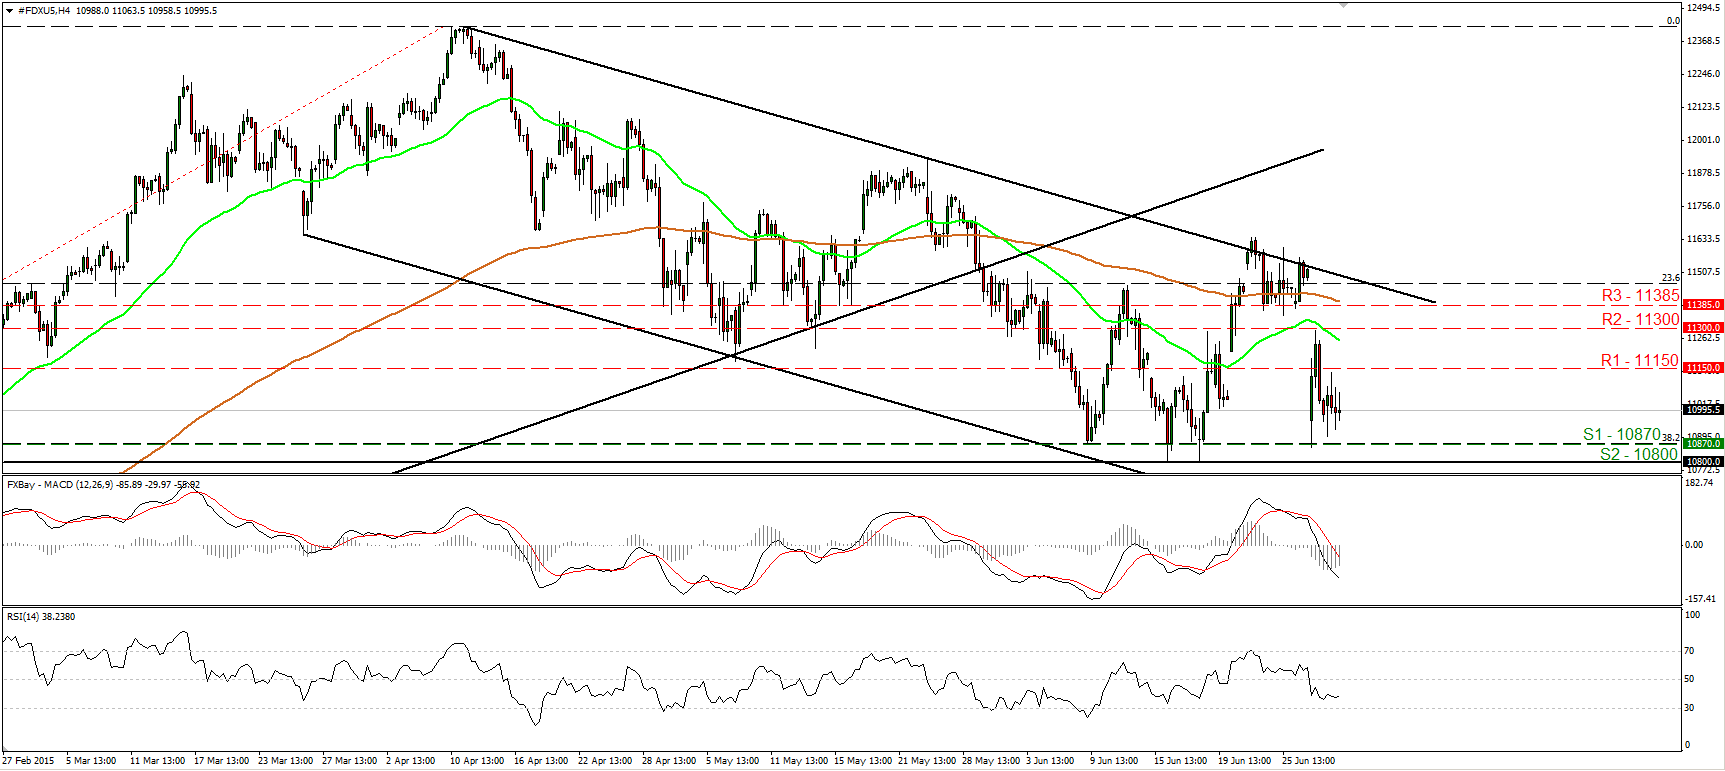
• DAX futures traded lower on Tuesday, and are currently trading above the key support line of 10870 (S1), which happens to be the 38.2% retracement level of the 16th of October – 10th of April advance. As long as the index is trading below the longer-term uptrend line taken from the low of the 16th of October, and within the downside channel that had been containing the price action since the last days of March, I would consider the outlook to be somewhat negative. Nevertheless, I would prefer to see a clear close below the 10800 (S2) zone before I get more confident on the downside. Such a break is likely to set the stage for extensions towards the 10600 (S3) support zone, marked by the lows of the 9th and 10th of February.
• Support: 10870 (S1), 10800 (S2), 10600 (S3)
• Resistance: 11150 (R1) 11300 (R2), 11385 (R3)
Gold fails to reach 1162
