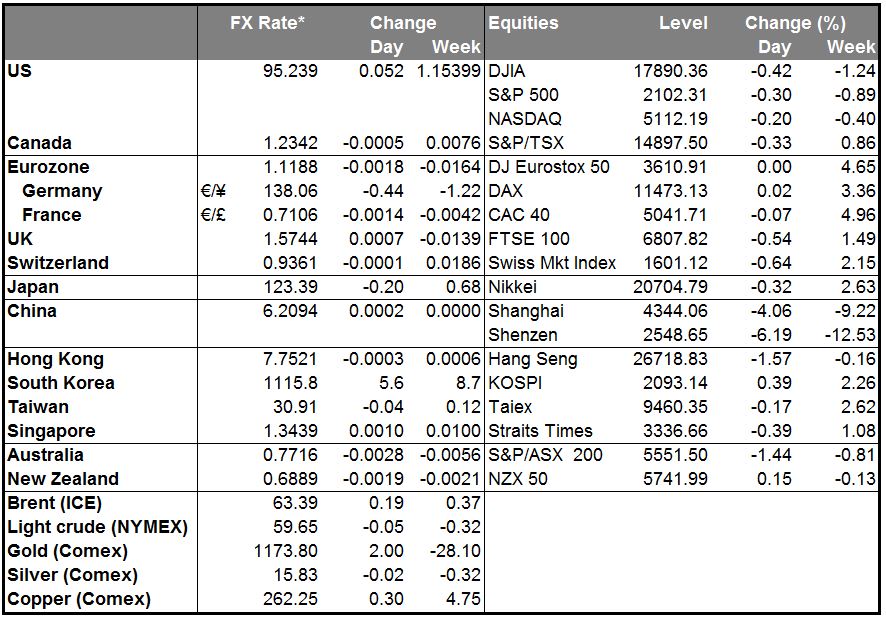
•Greek talks break up with no resolution, to continue tomorrow…or did I use that headline yesterday? It seems I could use the same comment every day, but just change the date. Greek crisis, talks, collapse, reconvene – just put those words in a different order every day.
• Talks broke up yesterday without a decision, and Eurozone finance ministers will reconvene Saturday for what’s being billed as “crucial” and “decisive” talks. German Chancellor Merkel said European leaders agreed that “everything must be done to find a solution on Saturday.” In practice, what that means is that the Greek side will have to move closer to what the creditors are demanding. It all then comes down to Greek politics. So no change, just the finish line is 24 hours closer. Tune in again on Sunday night!
• If they can’t reach an agreement, then the country probably won’t be able to pay the €1.5bn it owes to the IMF on Tuesday. The good news is that failure to pay the IMF technically is not defined as a “default.” The real, final, last, no-kidding-around deadline, therefore, isn’t actually Tuesday. That honor probably belongs to the July 20th €3.5bn payment due to the ECB. If Greece misses that payment, then the ECB would have a hard time continuing with the illusion that the banking system is solvent and would probably have to turn off the Emergency Liquidity Assistance (ELA) that is keeping the Greek banking system afloat = game over. Before that, on July 14th, the country has a ¥20bn samurai bond coming due. That’s much smaller, though.
• Greek crisis could affect CHF The resolution – or not – of the Greek crisis is likely to have big implications for the Swiss franc, because of its characteristics as a “safe haven” currency. Swiss National Bank President Thomas Jordan Thursday made a speech to the Swiss watch industry, in which he pointed out that the CHF is “significantly overvalued” and said that the country’s monetary policy was geared to dealing with this situation. Then he added, “However, in the current climate there is, regrettably, no easy solution that would absorb all external disruptions. We must accept these challenging economic conditions for the time being.” What kind of “external disruptions” is he talking about? Probably Greece. In other words, he’s warning that EUR/CHF could move down again if Greece defaults.
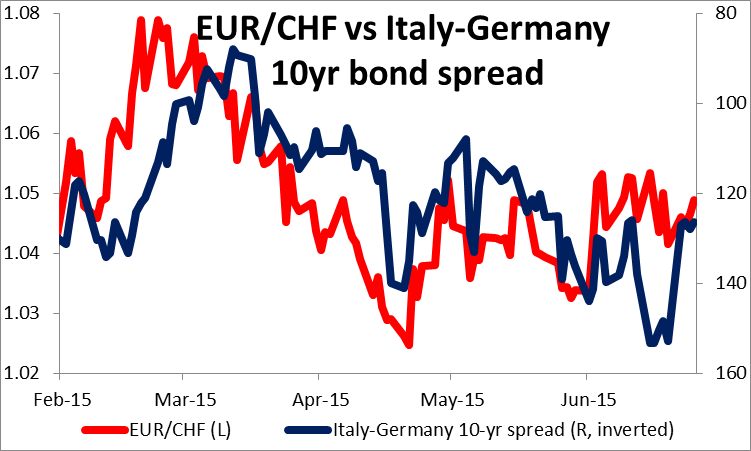
• People who are interested in playing the Eurozone crisis might want to look at that pair. EUR/CHF tracks the spread between Italian and German bonds fairly well, demonstrating that EUR/CHF does respond pretty closely to concerns about what’s happening with Greece.
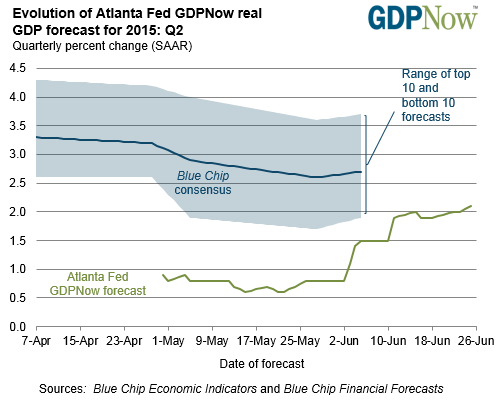
• US indicators continue to improve Away from Greece, yesterday’s US economic indicators continued to improve and Fed funds rate expectations moved higher again as a result, supporting USD against most currencies. US consumer spending rose the most in nearly six years on demand for autos and other big-ticket items. Personal income also rose and previous months were revised up, which caused many forecasters to raise their estimate of Q2 GDP. The Atlanta Fed raised its forecast by 0.1 ppt to 2.1%, and it’s at the bottom end of forecasts. The core personal consumption expenditure deflator, the Fed’s favorite inflation measure, continued to rise at 1.2% yoy in May, but the 3 month annualized pace of change has now risen to 1.6% from 0.6% in February – this will reassure the Fed that its 2% inflation target is indeed within reach. Stronger growth, an improving labor market and stable or rising inflation should pave the way for a first hike in the Fed funds rate in September, expectations of which should support the dollar.
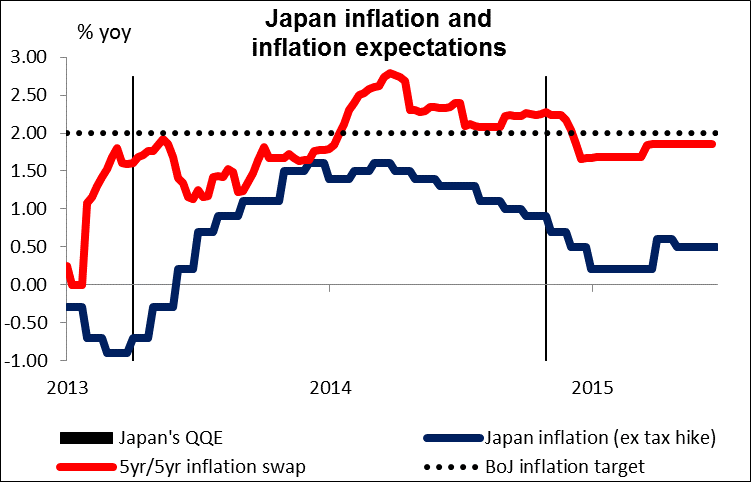
• Japan inflation slows further As the impact of the April 2014 hike in the consumption tax continues to drop out of the year-on-year calculation, Japanese inflation slowed further, although not as much as expected. The national CPI decelerated to +0.5% yoy in May from +0.6%, while the core-of-core inflation (excluding food and energy) was unchanged at +0.4% yoy. Tokyo headline for June decelerated even more (+0.3% yoy from +0.5%), but core was up a touch (but still near deflation at +0.2% yoy from +0.1%). The fact that core inflation is running below headline inflation shows that it isn’t just the impact of cheaper oil that’s pushing down prices. Moreover, inflation continues to decelerate even though the unemployment rate remains exceptionally low (3.3%) and the job-offers-to-applicants ratio is rising (1.19 from 1.17), suggesting that the labor market remains under upward pressure. While no one expects the Bank of Japan to increase its stimulus right away, I do think that they’ll have to do more later on this year if things continue the way they’re going. That should weaken the yen.
• Today’s highlights: During the European day, EU leaders will conclude their two-day summit. The draft communique said that EU leaders will review the state of negotiations with Britain on its EU membership in December, according to Reuters. A regular EU summit is scheduled for Dec. 17-18.
• As for the indicators, Eurozone’s M3 money supply is forecast to have risen 5.4% yoy in May, a slight acceleration from 5.3% yoy previously. The 3-month moving average is expected to accelerate if the forecast is met. French consumer confidence for June is also to be released.
• From Sweden, retail sales for May are forecast to rise, a turnaround from the previous month. This could add to the recent strong data and strengthen SEK somewhat.
• In the US, the final University of Michigan consumer sentiment for June is coming out along with the surveys of 1-year and 5-to-10 year inflation expectations.
• As for the speakers, Bank of England Governor Mark Carney speaks.
The Market
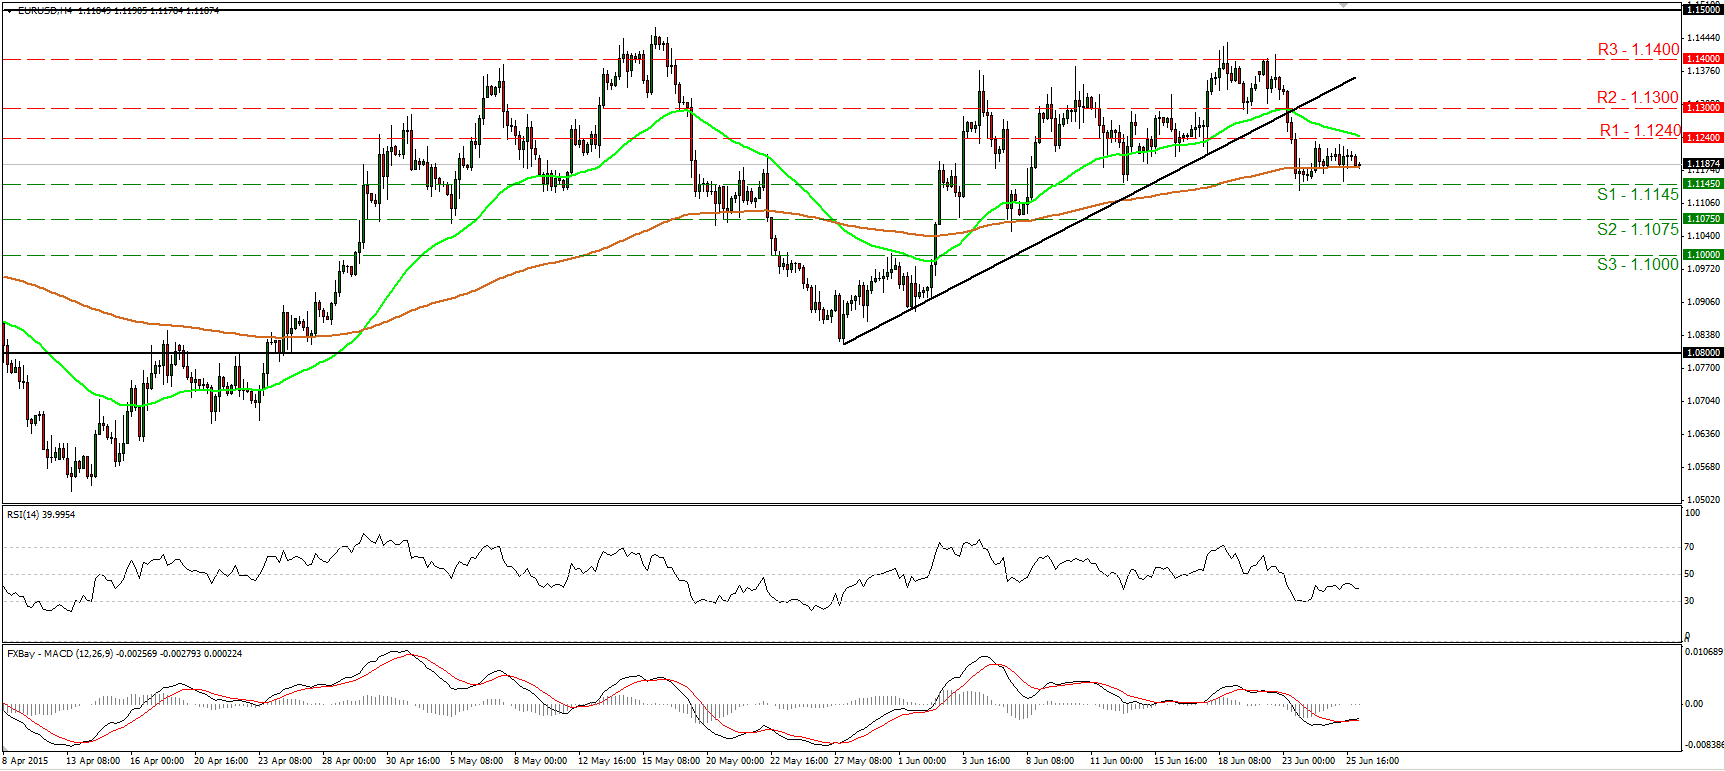
EUR/USD trades in a consolidative manner
• EUR/USD traded in a sideways mode on Thursday, staying between the support line of 1.1145 (S1) and the resistance of 1.1240 (R1). As long as the rate is trading below the short-term uptrend line taken from the low of the 27th of May, and since the possibility for a lower high below that line still exists, I would consider the short-term outlook to be negative. A dip below 1.1145 (S1) is likely to signal further declines and perhaps challenge our next support at 1.1075 (S2). However, taking a look at our oscillators, there is still the likelihood for an upside corrective bounce. The RSI, although below 50, looks ready to turn up again, while the MACD still stands below its trigger line and points somewhat north. In the bigger picture, I would maintain my neutral stance. I believe that a move above the psychological zone of 1.1500 is the move that could carry larger bullish implications, while a break below 1.0800 is needed to confirm a forthcoming lower low on the daily chart and perhaps turn the overall bias back to the downside.
• Support: 1.1145 (S1), 1.1075 (S2), 1.1000 (S3)
• Resistance: 1.1240 (R1), 1.1300 (R2), 1.1400 (R3)
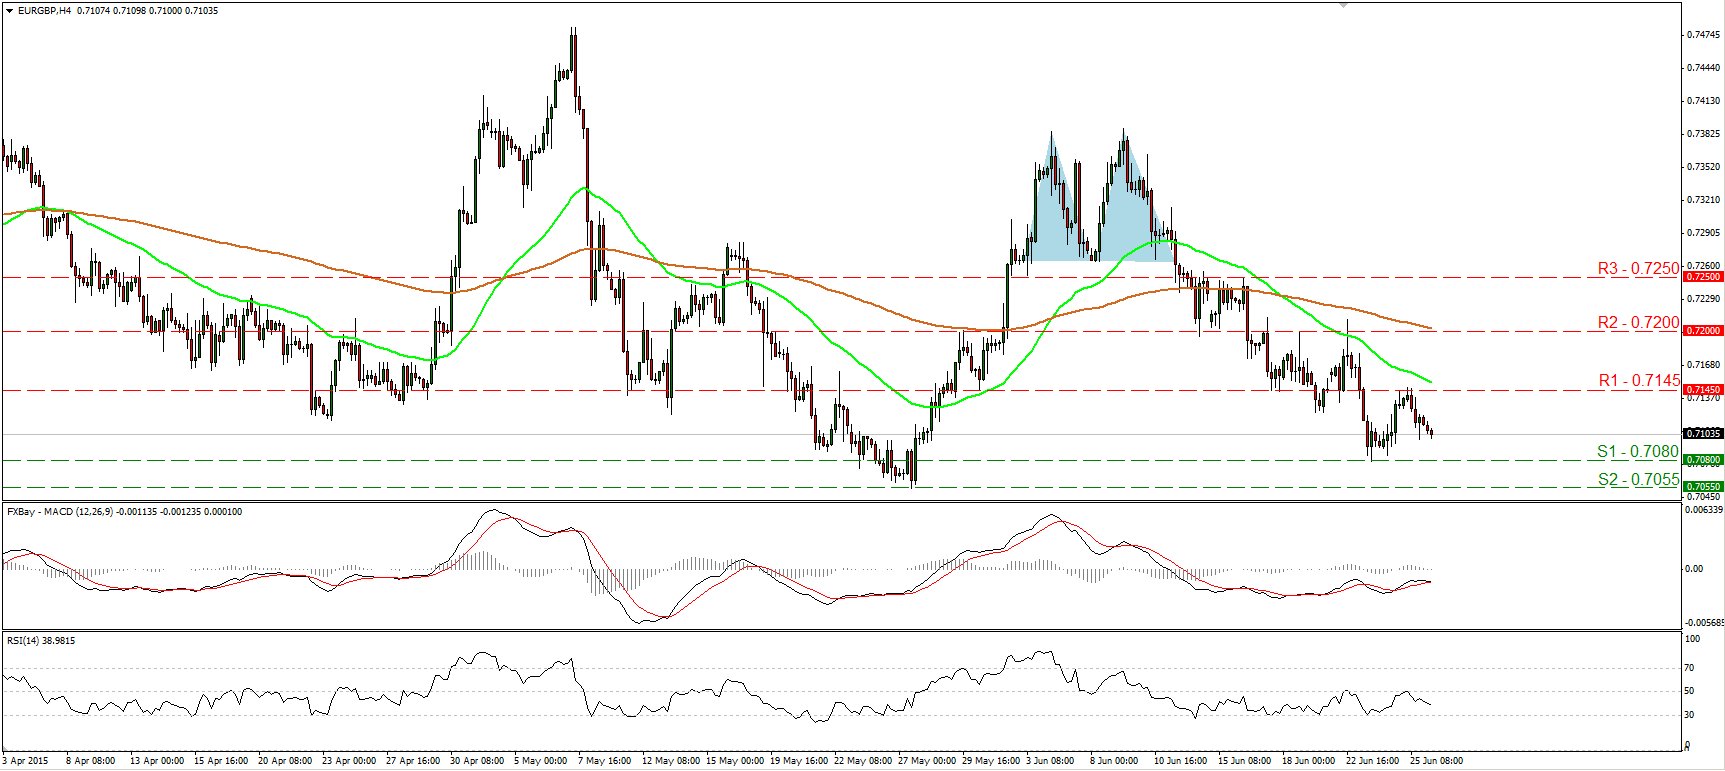
EUR/GBP tumbles after finding resistance 0.7145
• EUR/GBP slid on Thursday after hitting resistance near 0.7145 (R1). Following the completion of a double top formation on the 12th of June, the price structure has been lower peaks and lower troughs. Thus, I believe that the short-term path of the pair remains to the downside. I would expect the rate to continue to trade lower and perhaps challenge again the support line of 0.7080 (S1). A break below that hurdle is likely to pave the way for the next support at 0.7055 (S2), marked by the low of the 27th of May. Our momentum studies reveal negative momentum and corroborate my view that the pair is likely to trade lower, at least in the near term. The RSI hit resistance at its 50 line and raced lower, while the MACD, although negative, has topped and could fall below its trigger line soon. On the daily chart, the pair has been trading in a non-trending mode since mid-March. Therefore, I would consider the overall outlook to be neutral.
• Support: 0.7080 (S1), 0.7055 (S2), 0.7000 (S3)
• Resistance: 0.7145 (R1) 0.7200 (R2), 0.7250 (R3)
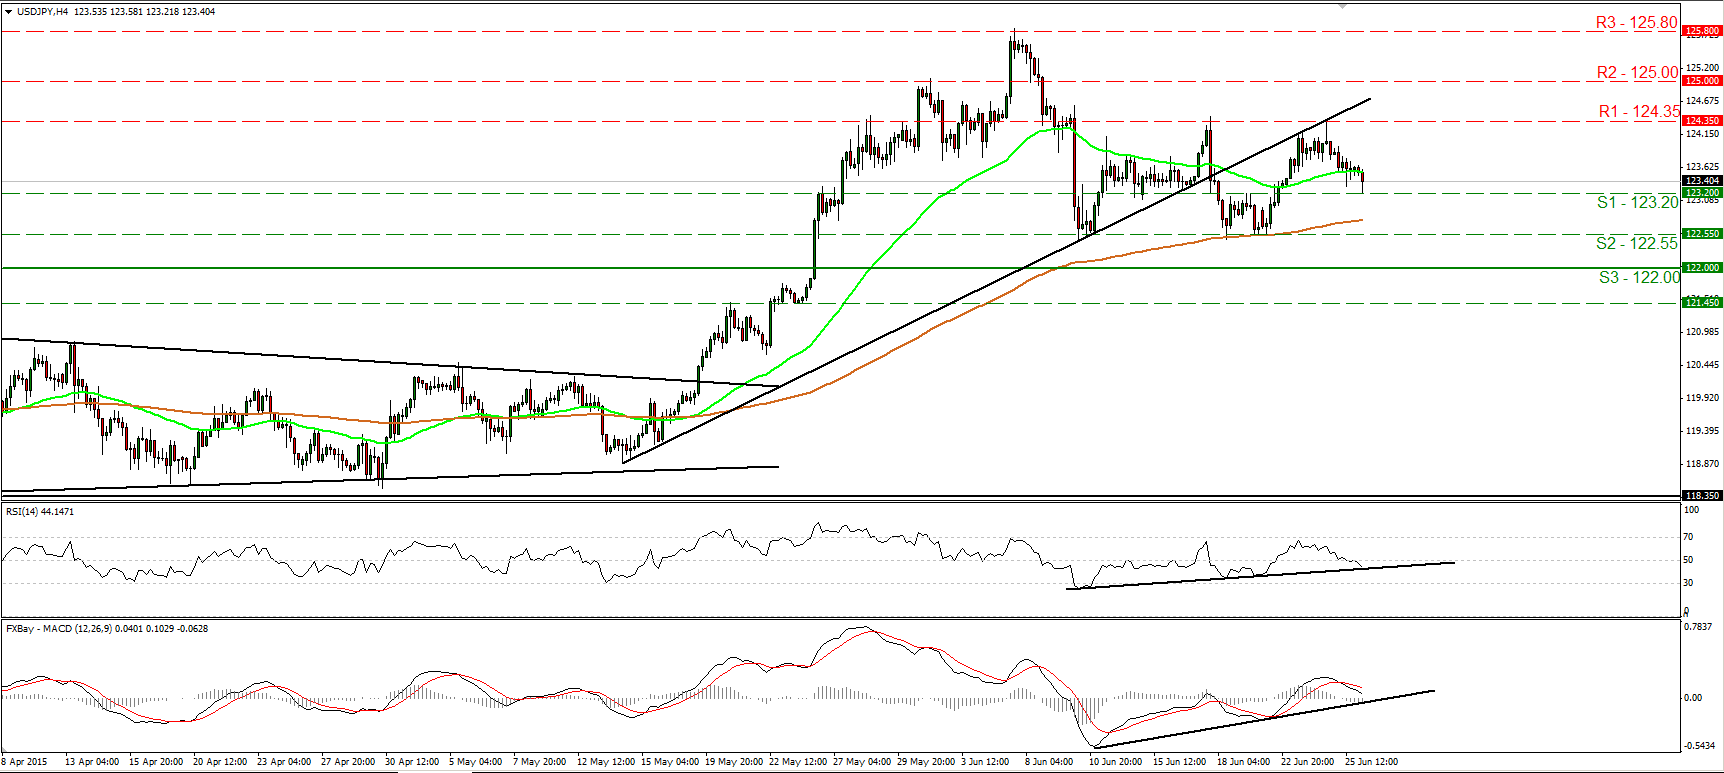
USD/JPY hits support at 123.20
• USD/JPY traded lower after it hit the prior uptrend line. During the early European morning, the rate is testing the support barrier of 123.20 (S1), where a decisive dip is likely to target once again the well-tested support zone of 122.55 (S2). Our short-term oscillators somewhat support the case. The RSI fell below its 50 line and is pointing south, while the MACD, although positive, has topped and fallen below its signal line. However, there is still positive divergence between both the oscillators and the price action, indicating decelerating downside momentum. As a result, I would expect any further downside extensions to remain short-lived. In the bigger picture, the break above the 122.00 (S3) zone on the 26th of May triggered the continuation of the long-term upside path. I would treat any further near-term declines as a corrective phase of the larger uptrend.
• Support: 123.20 (S1), 122.55 (S2), 122.00 (S3)
• Resistance: 124.35 (R1), 125.00 (R2), 125.80 (R3)
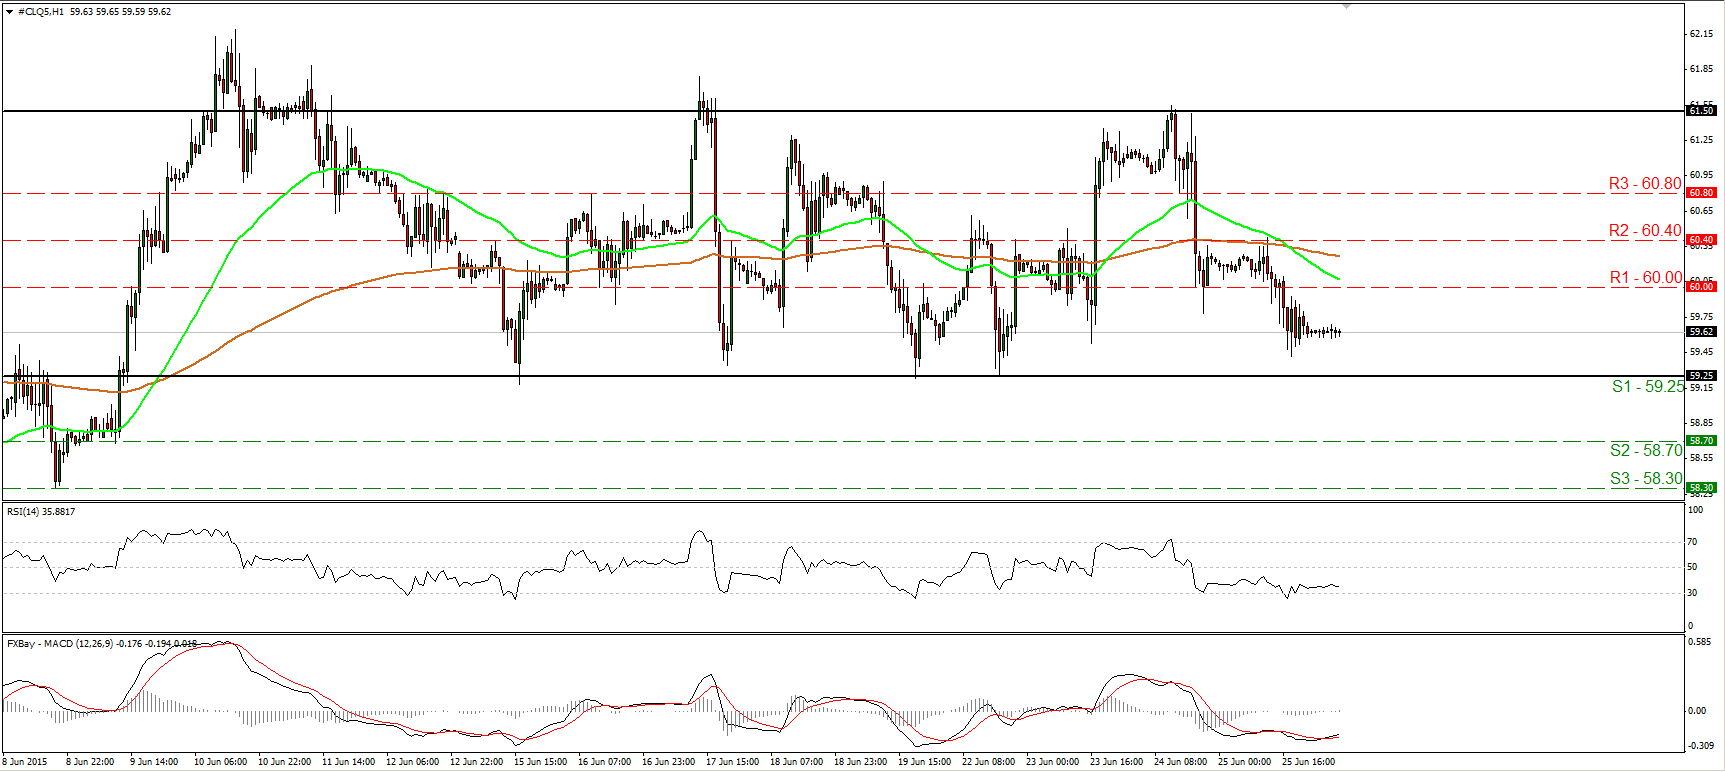
WTI in a sideways range
• WTI tumbled yesterday, falling back below the round figure of 60.00 (R1). WTI has been oscillating between the support of 59.25 (S1) and the resistance of 61.50 (R1) since the 11th of June. As a result, I would see a neutral short-term picture. I would expect another test at the lower bound of the sideways range, where there is a high possibility for a rebound. As for the broader trend, the break above 55.00 on the 14th of April signaled the completion of a double bottom formation, which could carry larger bullish implications in the not-too-distant future. However, WTI has been trendless since the beginning of May and this is supported by our daily oscillators as well. Both the 14-day RSI and the daily MACD lie near their equilibrium lines and point sideways.
• Support: 59.25 (S1), 58.70 (S2), 58.30 (S3)
• Resistance: 60.00 (R1) 60.40 (R2), 60.80 (R3)
Gold trades somewhat lower
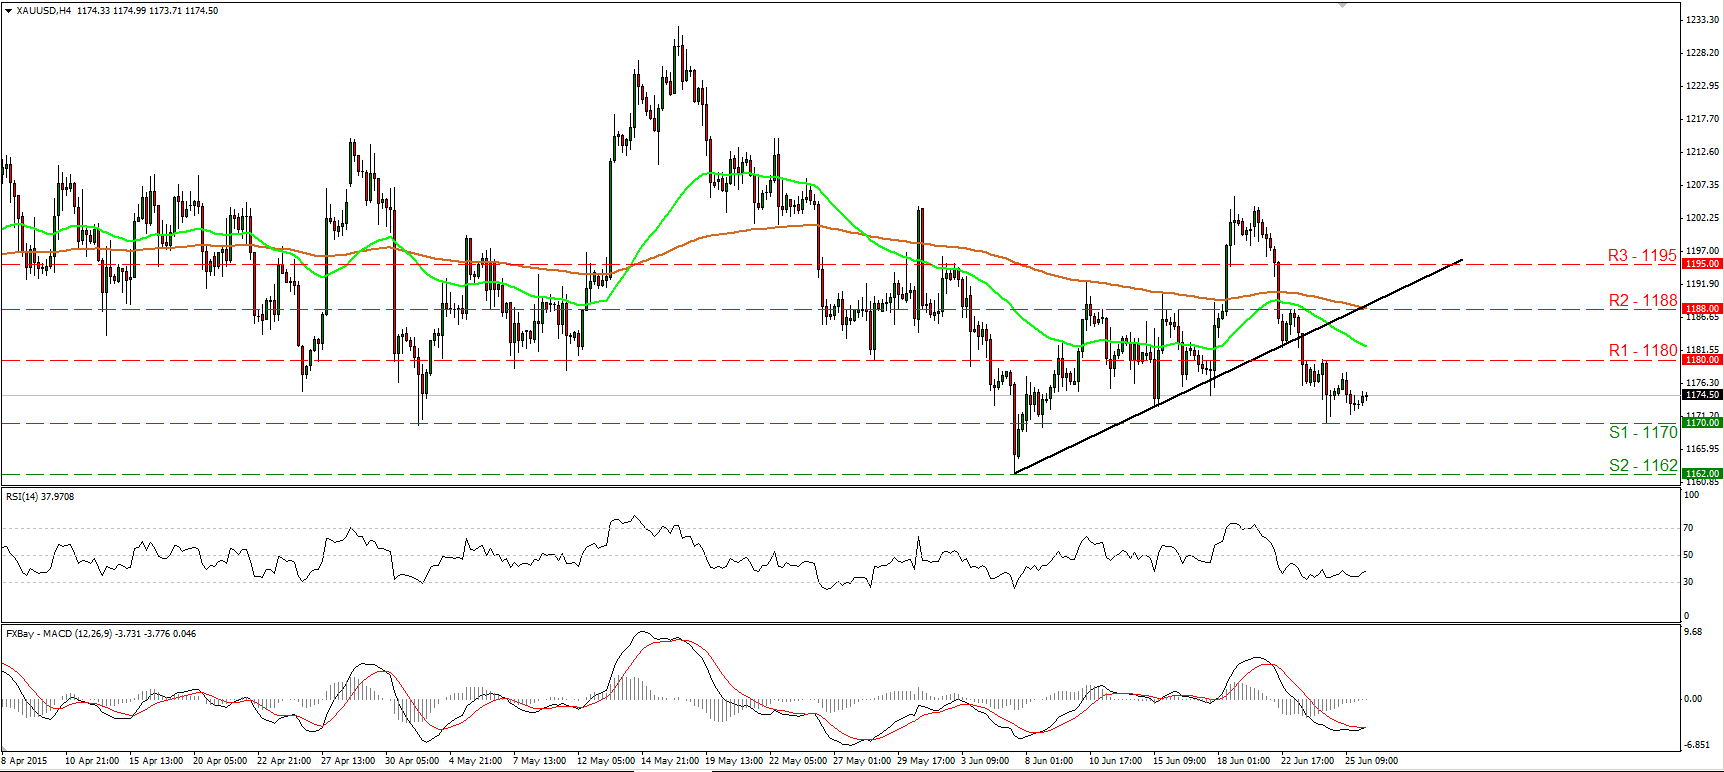
• Gold traded somewhat lower on Thursday, but the decline stayed limited above the support barrier of 1170 (S1). As long as the metal is trading below the short-term uptrend line drawn from the low of the 5th of June, I would consider the short-term picture to be somewhat negative. A move below 1170 (S1) is likely to set the stage for larger bearish extensions and perhaps target the support of 1162 (S2), defined by the low of the 5th of June. However, I still see signs that an upside corrective move could be on the cards before the bears pull the trigger again. The RSI has turned up again after finding support above its 30 line, while the MACD has bottomed and poked its nose above its trigger line. A clear move above 1180 (R1) would confirm the corrective move and perhaps open the way for the next resistance at 1188 (R2). As for the bigger picture, the overall outlook remains somewhat negative. However, I prefer to see a decisive close below the previous low at 1162 (S2), before I get more confident on the downside.
• Support: 1170 (S1), 1162 (S2), 1153 (S3)
• Resistance: 1180 (R1), 1188 (R2), 1195 (R3)

