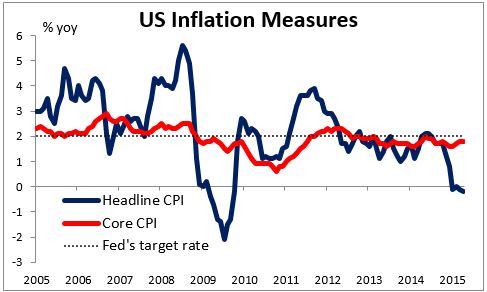
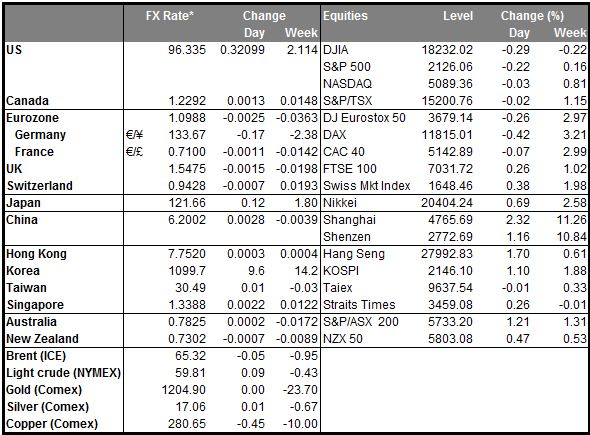
US CPI, Yellen restore dollar’s uptrend Friday’s announcement of a faster-than-expected rise in the core US CPI, coupled with some hawkish comments from Fed Chair Janet Yellen, have restored the dollar’s uptrend for now. “If the economy continues to improve as I expect, I think it will be appropriate at some point this year to take the initial step to raise the federal funds rate,” she said. As I mentioned last week, her view – and that of the FOMC in general – is significantly different than the market’s. Although Yellen did say that she expects the pace of normalization “to be gradual,” the market is currently discounting a Fed funds rate at end-2017 of 1.74%, which is only about half what the FOMC forecast last March (between 3.2% and 3.6%, depending on how you calculate it). USD was up across the board this morning as market expectations for Fed funds rose somewhat on Friday. I would expect rate expectations to continue to rise and for the dollar’s uptrend to continue as a result.
Spain votes in anti-austerity party = EUR-negative Local elections in Spain Sunday gave several major victories to the anti-austerity parties Podemos and Ciudadanos. Meanwhile, the ruling People’s Party suffered its worst result in a municipal election for 24 years. The result is likely to make it even more difficult to resolve the Greek crisis because Spain will not want to vindicate the rebellious approach of the SYRIZA coalition. Doing so would only show the Spanish voters that the approach of parties like Podemos can win concessions. I would expect the ruling parties of Spain and Portugal to dig in their heels in negotiations with Greece, making it even harder to reach a settlement. The Greek Interior Minister Sunday said on TV that the country didn’t have the money to meet pension and wage bills in June and also make required payments to the IMF, meaning the country will have to default if no agreement is reached in the next couple of weeks.
Japan’s trade deficit narrows Japan’s trade deficit narrowed in April as exports rose more than expected (8% yoy vs expected 6%). Export volume to the US and China rose, with auto exports to the US in particular gaining. Imports meanwhile fell 4.2% as oil prices fell. USD/JPY rose nonetheless as Tokyo stocks opened sharply higher. I expect that the authorities will want to continue with what’s working, namely a weaker yen.
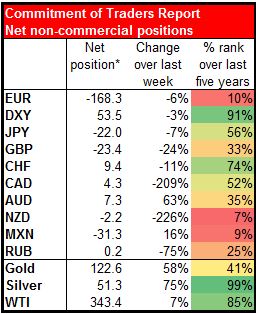
Speculators continue to cut positions The weekly Commitment of Traders report showed that speculators continued to trim their long USD positions and their short currency positions. This leaves the market room to extend USD longs again if it appears that the dollar’s uptrend is resuming.
Today’s highlights: It’s likely to be a quiet day in the markets today as the US and UK markets are closed today for Memorial Day and a spring bank holiday, respectively, while several Continental European countries observe Whit Monday. The only noteworthy data out today is the Japanese trade figures, which are out already.
On Tuesday, in the US, durable goods orders for April are coming out. If the core figure -- durable goods excluding transportation equipment -- rises, as the market expects, that could be seen as the possible start of a turnaround in business investment and would be considered bullish for the dollar. New home sales for April are also due out. Following the better-than-expected housing starts and building permits on Tuesday, if the new home sales show a firming housing sector, this could support USD.
On Wednesday, the main event will be the Bank of Canada rate decision, the only G10 central bank to meet this week. The market expects no change in policy, so the impact on CAD will depend on the tone of the statement and the Bank’s inflation and growth projections. I would expect a more optimistic statement in line with the recent speech by BoC Governor Poloz, who said that the Bank’s two policy pillars — an inflation target of 2% and economic output running at full capacity by the end of 2016 — remain on track. Coming on top of the firm oil price in recent weeks, a positive statement could strengthen CAD somewhat.
Also Wednesday, the Bank of Japan releases the minutes of its April 30 meeting. These are not the minutes from the most recent meeting but rather from the previous one, where they bowed to reality and downgraded their inflation forecasts. Considering that at their latest meeting they kept policy steady again, the minutes of the previous meeting shouldn’t be of much interest.
On Thursday, the 2nd estimate of the UK GDP for Q1 is expected to be revised up, confirming modest growth momentum in early 2015. The expected upward revision along with the recent strong data that suggest an even better growth rate in Q2 are likely to keep GBP well supported. In the US, we get the initial jobless claims for the week ended May 23 and pending home sales for April.
On Friday, during the Asian day, we have the usual end-of-month data dump from Japan. The focus will be on the National CPI rate for April and the Tokyo CPI rate for May. The national CPI rate for April will probably fall to zero, now that the effect of the consumption tax hike in April 2014 will fall out from the year-on-year comparison. That could raise expectations of further BoJ easing, although as I mentioned, this isn’t likely to come for several months at the earliest.
In the US, on the other hand, Q1 GDP is expected to be revised down to show that the US economy contracted 0.9% at a qoq SAAR, a downward revision from the already disappointing +0.2% qoq expansion seen in the first estimate. I would take the soft Q1 results with a grain of salt and would focus mainly on the data showing the improvement in the economic activity in Q2.
The Market
EUR/USD collapses after US inflation data and Yellen’s speech
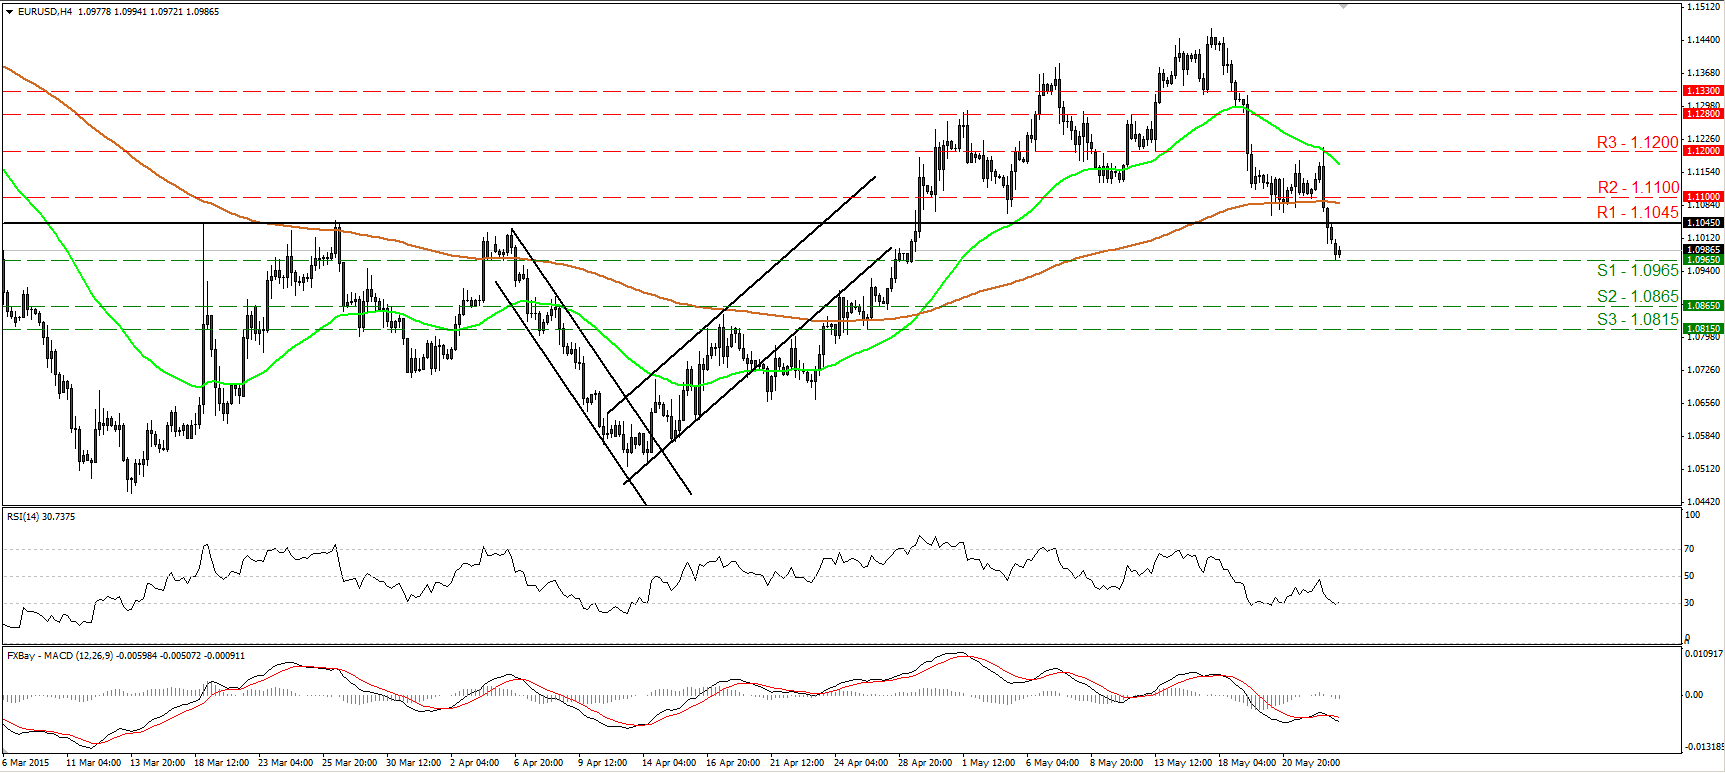
EUR/USD plunged on Friday, following the higher-than-expected US core inflation rate and Fed Chair Janet Yellen’s comments about an interest rate hike in 2015. The rate tumbled below the key barrier of 1.1045 (R1) and hit support below the round number of 1.1000, at 1.0965 (S1). The short-term outlook now has turned negative, and as a result, I would expect a clear break below 1.0965 (S1) to open the way for the next support at 1.0865 (S2). Both our short-term oscillators detect negative momentum and amplify the case for further declines. The RSI hit resistance near its 50 line and raced lower, while the MACD, already negative, fell below its trigger line. Nevertheless, bearing in mind that the RSI hit support at its 30 line and turned up, I would be careful of a possible pullback before the bears take control again. On the daily chart, the move below the 1.1045 (R1) barrier increases the likelihood that the 13th of April – 15th of May recovery was just a corrective move and that the prior downtrend could now be resuming.
• Support: 1.0965 (S1), 1.0865 (S2), 1.0815 (S3).
• Resistance: 1.1045 (R1), 1.1100 (R2), 1.1200 (R3).
GBP/USD breaks below the uptrend line
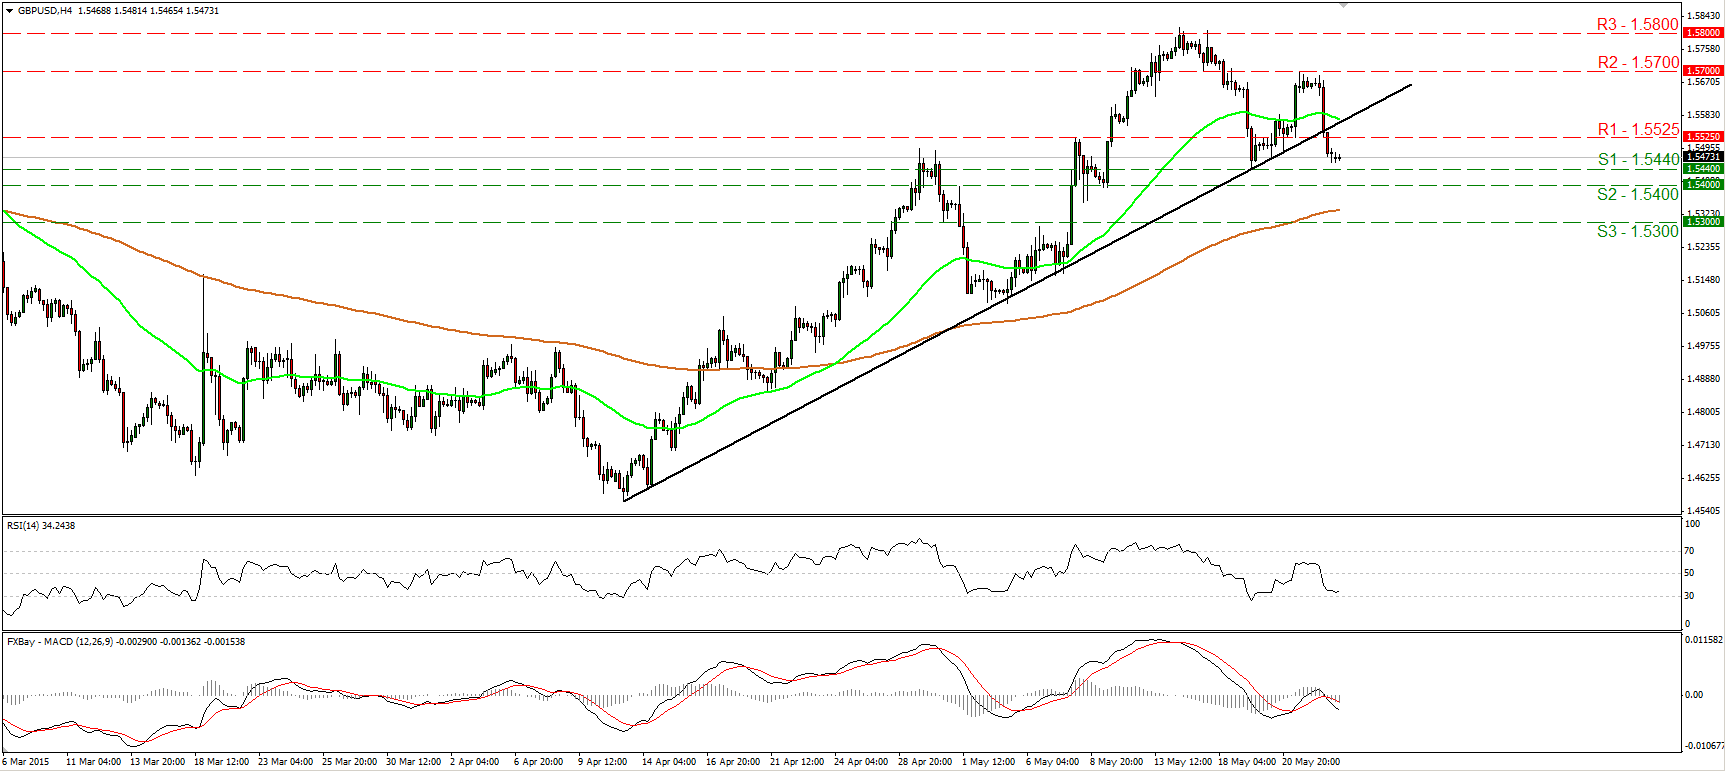
GBP/USD also collapsed after the US inflation data and Yellen’s comments. The rate fell below the support (now turned into resistance) of 1.5525 (R1) and below the uptrend line taken from back the low of the 13th of April. Nevertheless, the decline was stopped slightly above the support line of 1.5440 (S1). In my opinion, a clear move below 1.5400 (S2) is needed to confirm a forthcoming lower low and signal the beginning of a newborn short-term downtrend. Such a break is likely to target our next support hurdle, at 1.5300 (S3). Switching to the daily chart, the rate is still trading well above the 80-day exponential moving average, but given that Friday’s decline brings into question the continuation of the uptrend started on the 13th of April, I would prefer to sit on the sidelines for now as far as the overall picture is concerned.
• Support: 1.5440 (S11.5400 (S2), 1.5300 (S3).
• Resistance: 1.5525 (R1), 1.5700 (R2), 1.5800 (R3).
EUR/JPY slides below 134.00
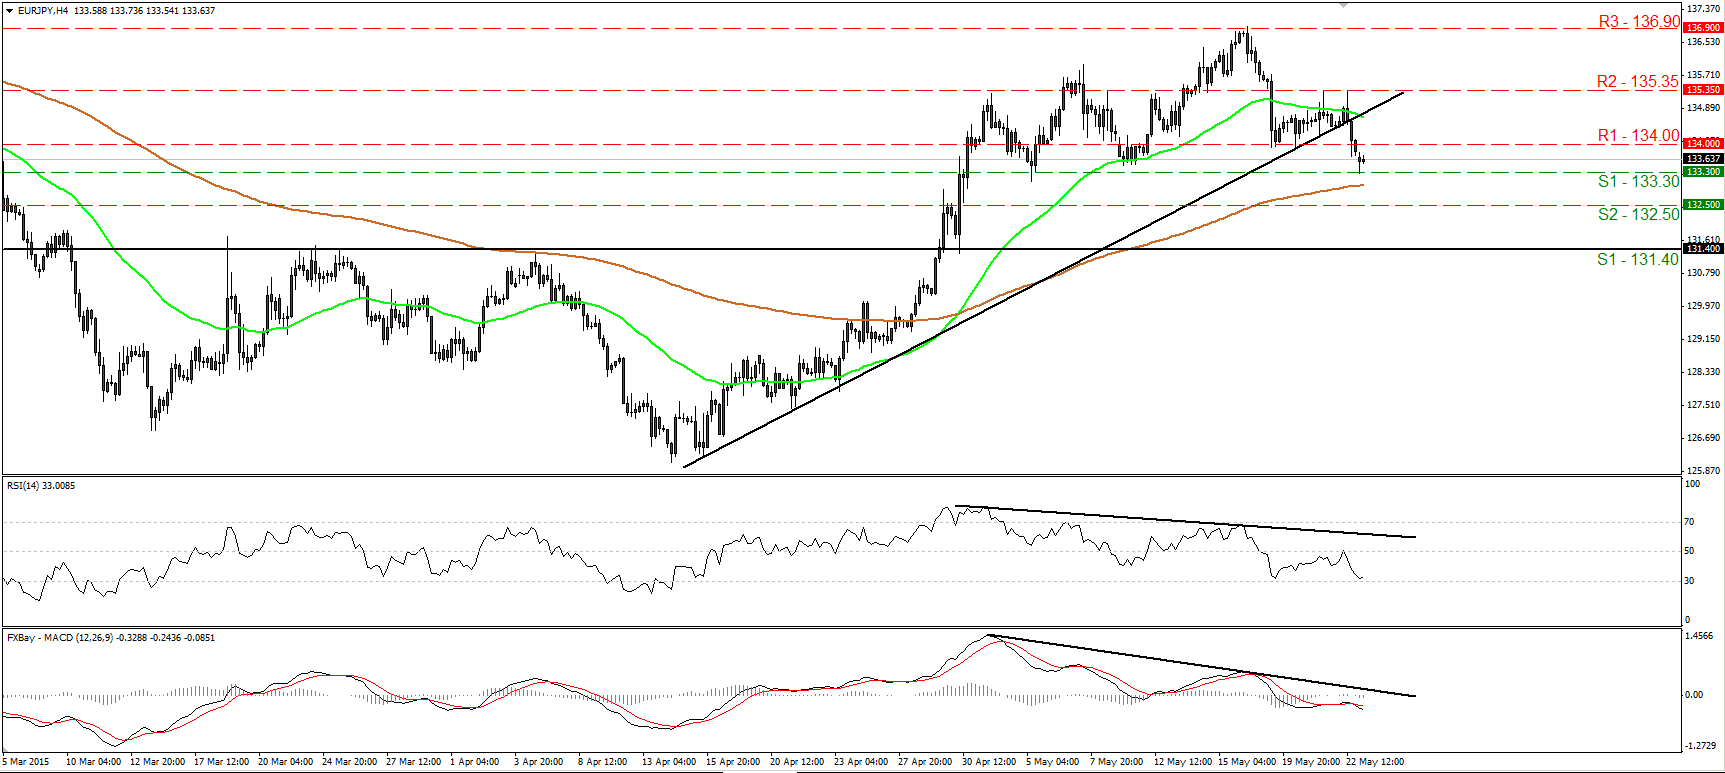
EUR/JPY fell below the uptrend line taken from the low of the 15th of April, and below the support (now turned into resistance) of 134.00 (R1). That move confirmed the negative divergence between our short-term oscillators and the price action and turned the short-term picture negative. I believe that a break below 133.30 (S1) is likely to see scope for more bearish extensions and perhaps target our next support at 132.50 (S2). Our oscillators detect bearish momentum and amplify the case that EUR/JPY is likely to trade lower in the near future. The RSI slid after hitting resistance near its 50 line, while the MACD, already negative, has fallen below its trigger line. On the daily chart, the break above 131.40 on the 29th of April signaled a possible trend reversal in my view. This keeps the medium-term picture somewhat positive. Therefore, I would consider any further declines that stay limited above 131.40 as corrective moves.
• Support: 133.30 (S1), 132.50 (S2), 131.40 (S3).
• Resistance: 134.00 (R1), 135.35 (R2), 136.90 (R3).
Gold hits resistance at 1215
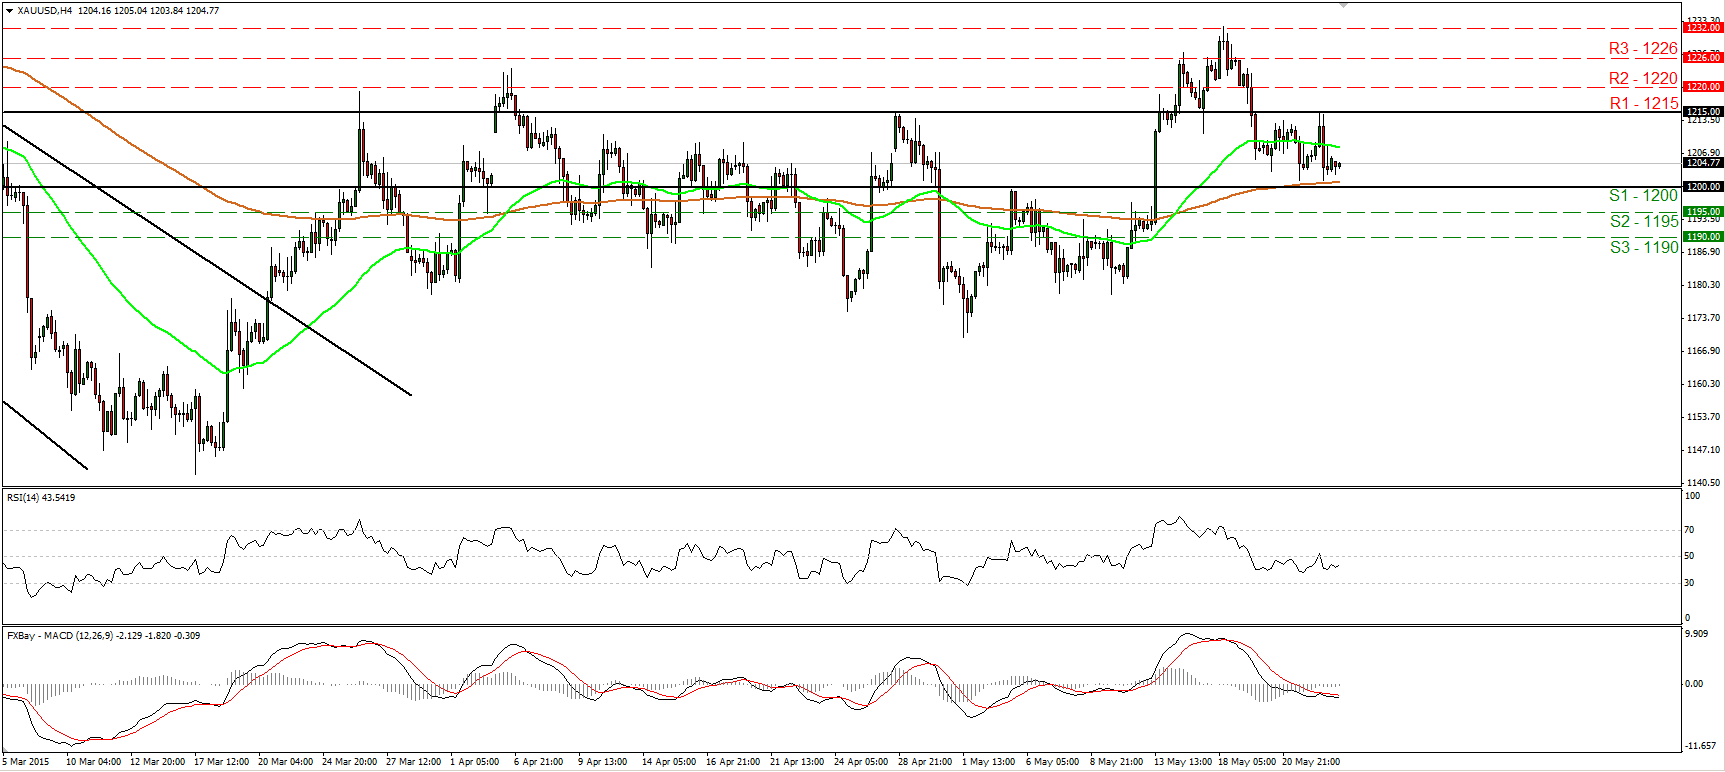
Gold started trading higher on Friday, but hit resistance at 1215 (R1) and slid back down to end the day virtually unchanged. The metal has been oscillating between that hurdle and the psychological barrier of 1200 (S1) since the 19th of May. Therefore, I would keep my flat stance as far as the short-term bias is concerned. On the daily chart, last Monday failed to close above 1226 (R3). I believe that a decisive close above that barrier is needed to turn the medium-term outlook to the upside. For now, I will hold a neutral stance as far as the overall picture of the yellow metal is concerned as well. This is also supported by our daily oscillators. The 14-day RSI is back near its 50 line, while the MACD, although positive, has topped and could fall back below its trigger line.
• Support: 1200 (S1), 1195 (S2), 1190 (S3).
• Resistance: 1215 (R1), 1220 (R2), 1226 (R3).
DAX trades in a consolidative mode
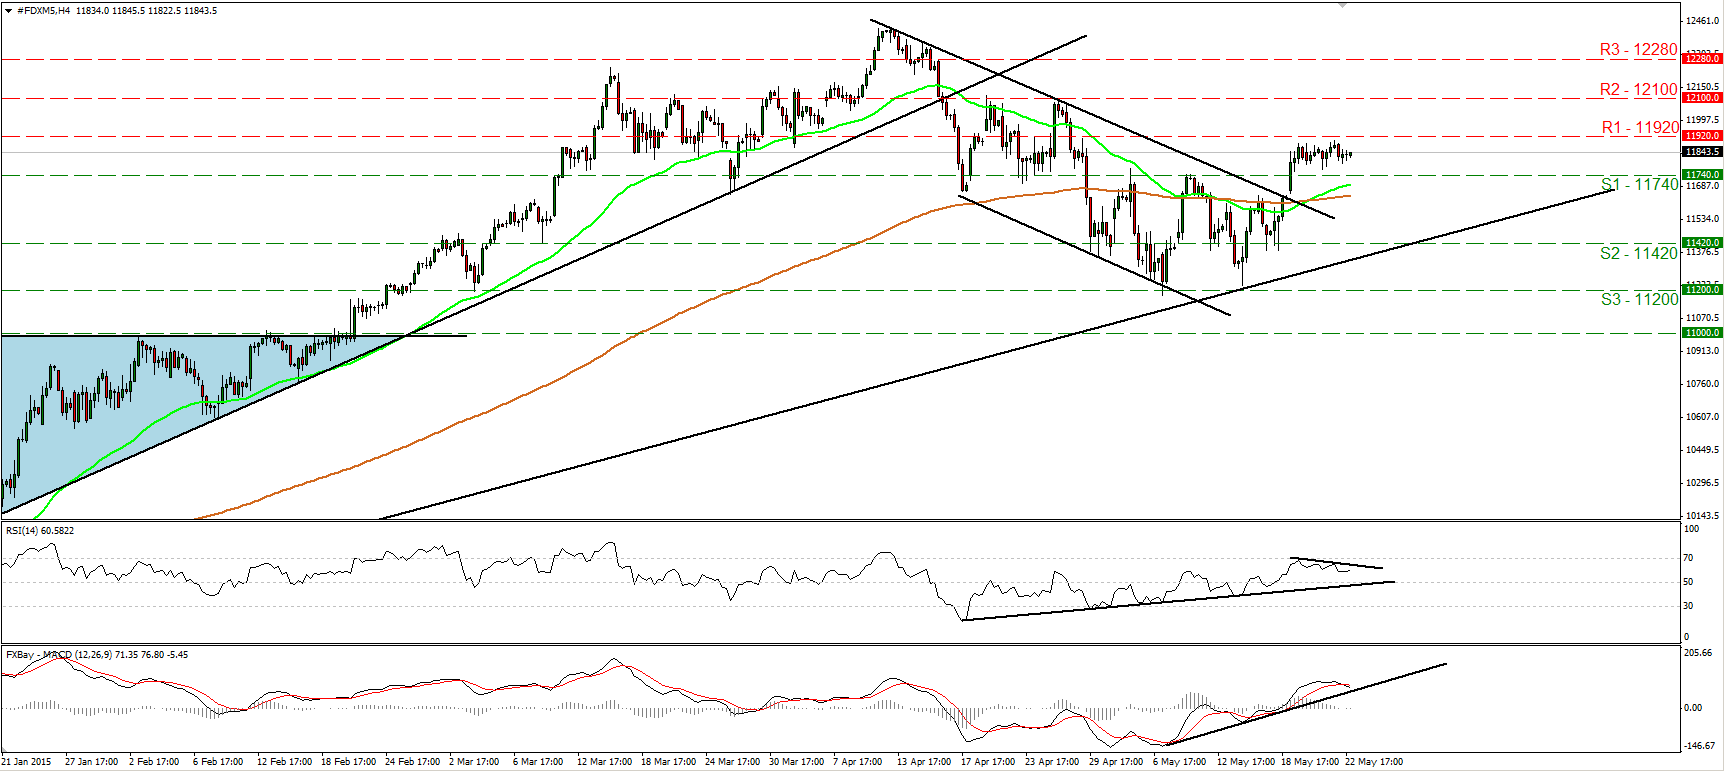
DAX futures traded in a sideways manner on Friday, remaining below the resistance line of 11920 (R1). This makes me believe that we could experience a minor correction before the index is headed higher. A break above the 11920 (R1) barrier is needed to restore the short-term positive picture, which could prompt extensions towards our next hurdle of 12100 (R2). Our short-term oscillators corroborate my view that a pullback could be on the cards. The RSI moved lower after hitting resistance near its 70 line, while the MACD has topped and fallen below its trigger line. There is also negative divergence between the RSI and the price action. On the daily chart, the index rebounded from the long-term uptrend line taken from back at the low of the 16th of October. This keeps the longer-term path to the upside in my view. Therefore, I believe that any short-term downside extensions are likely to provide renewed buying opportunities.
• Support: 11740 (S1), 11420 (S2), 11200 (S3).
• Resistance: 11920 (R1) 12100 (R2), 12280 (R3).

