PMIs show Europe on top
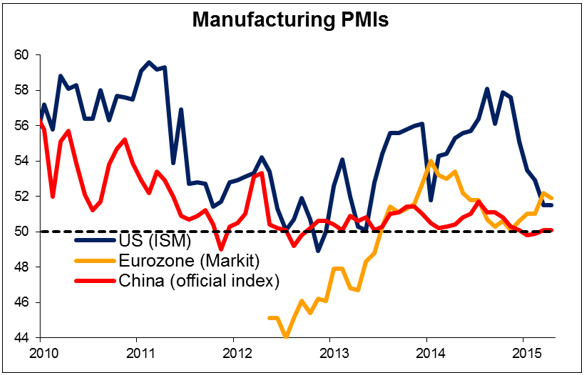
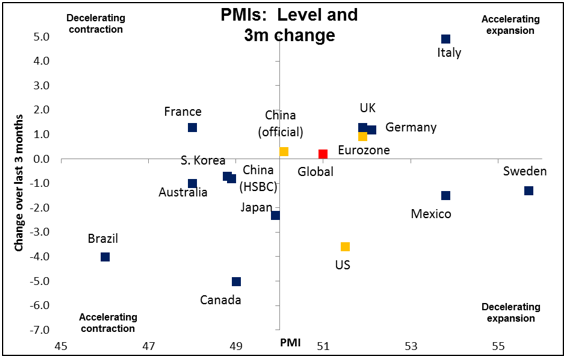
Yesterday’s purchasing managers indices (PMIs) for April showed Europe on top of the world, apparently. The Markit manufacturing PMI for the eurozone moved above the ISM manufacturing index, something that does not happen often and is usually accompanied by a stronger euro. Past performance is no guarantee of future performance however, especially as ECB monetary policy is not likely to change no matter how strong the PMIs get. Meanwhile of the top 28 countries reporting so far, the top 10 are all European. Italy has shown the biggest improvement over the last three months, which perhaps is testimony to the benefit of starting pretty low. Note though that Sweden is the top-rated country (furthest to the right on the graph below), indicating that the Riksbank is more worried about deflation than about the overall health of the economy, which seems to be relatively robust. Perhaps they can afford to worry less about deflation in the future, in which case SEK could gain. Unfortunately the Greek PMI (not shown) fell, indicating that the turmoil there is damaging confidence and the economy. Canada deteriorated notably. Asian PMIs (not shown) were fairly negative, for example with Singapore falling to 49.4, the lowest since February 2013. Manufacturing activity in other Asian countries, such as South Korea, Taiwan and Indonesia, also shrank. That suggests global growth is slowing, which would be negative for the growth-sensitive commodity currencies.
Fed’s Evans: the dove still sings
Chicago Fed President Charles Evans yesterday lived up to his reputation as a dove. He said the economy did appear to be on a “sustainable growth path, which, on its own, would support a rate hike soon.” However he said he would like to see “confirmation” that the weakness in Q1 was only transitory and repeated his call to hold borrowing costs near zero until early 2016. He doesn’t see inflation reaching the Fed’s 2% goal until 2018. This probably shows what one of the extremes on the FOMC is, not what the FOMC consensus is.
RBA cuts 25 bps, as expected; AUD strengthens
The RBA cut rates by 25 bps today, as expected. It said further declines in the currency seem likely and necessary because of the fall in commodity prices. Nonetheless, the AUD rebounded sharply after the news, apparently because the RBA removed the easing bias from its statement. I don’t think that’s appropriate, however. The RBA did the same thing back when it last cut rates back in February. Then too the last paragraph gave no indication about the future direction of rates. Admittedly, the overall economic assessment back in February was more pessimistic than it was this time although the conclusion – that “(t)he economy is likely to be operating with a degree of spare capacity for some time yet” and inflation would remain “consistent with the target” – was exactly the same. Admittedly, when it cut rates before then, in August 2013, it said that “The Board will continue to assess the outlook and adjust policy as needed…” but then it left rates unchanged until February 2015. So we see that it can move three months after making no comment on its intentions, while it can leave rates unchanged for 1 ½ years after suggesting further action is coming. In other words, I wouldn’t read too much into the fact that there was no comment on the bias in rates. I expect a further slowdown in China and a further slowdown in business investment in Australia, which should lead to further interest rate cuts and a weaker currency.
A big day for Greece tomorrow
The Greek government is apparently redoubling its efforts to find some agreement that will allow the ECB to continue to finance Greek banks. The ECB’s regular weekly meeting tomorrow will reportedly consider the discount (known as the “haircut”) applied to the collateral that Greek banks post in return for Emergency Liquidity Assistance (ELA). Currently the discount is said to be 23%. The Greek newspaper Kathimerini says the ECB will consider raising it to 44%, 65% or 80%. If it raises the haircut, then banks will either have to come up with more collateral or they will receive less funds, in which case they would have to call in some loans. That would increase pressure considerably on the Greek government.
Deputy Prime Minister Yiannis Dragasakis is to meet with ECB President Draghi in Frankfurt today along with Euclid Tsakalotos, the alternate foreign minister who has been tasked with “coordinating” Greece’s negotiating team. They will try to get the ECB to increase the amount of ELA funds it extends to Greece and raise the ceiling on the amount of T-bills Greece is allowed to issue. The problem is, the ECB can only supply ELA funds to solvent banks. But if the Greek government defaults, that would probably push a lot of the Greek banks into bankruptcy (because so much of their assets are Greek government bonds). If the talks between the “institutions” and the Greek government are going well, then the ECB can assume that Greece won’t default. But if the talks do not make any progress, then eventually the ECB will have to pull the plug on Greece.
Meanwhile, the IMF has warned that Greece is so far off course on its bailout program that the IMF may no longer be able to support it unless European lenders write off significant amounts of its sovereign debt. If the IMF withholds its half of a €7.2bn tranche of bailout aid, Greece would probably run out of cash this month. This puts Greece’s Eurozone creditors in a bind. They are adamantly opposed to debt relief, but IMF support is crucial.
Once again the ECB or IMF, whose members do not have to run for election, may be forced to do what the politicians don’t have the courage to do. Nobody wants their fingerprints on the gun that kills the eurozone.
Today’s highlights:
The European day starts with Sweden’s industrial production for March. The forecast is for a turnaround to +0.2% mom from -0.1% mom in February. This could add to the Krona’s strength following the Riksbank’s unexpected decision to leave its official cash rate unchanged.
In the UK, we get the construction PMI for April, which is forecast to have declined to 57.4 from 57.8. On Friday, the country’s manufacturing PMI for the month showed a decline as well. A decline in the construction PMI would confirm the slowdown in growth signaled by the manufacturing index. Coming after the weaker GDP growth rate for Q1, the PMIs give additional evidence that the UK economy is losing momentum.
In the US, the final Markit service-sector PMI for April is expected to confirm the initial estimate. Investors’ attention however will as usual focus on the ISM non-manufacturing PMI, which is forecast to have declined somewhat. This could hurt the dollar a bit. The US trade balance for March is also coming out.
No important speakers are scheduled on Tuesday.
During the Asian day before we come back in tomorrow, Australia will announce retail sales for March. They are expected to slow to +0.4% mom from +0.7% mom, which could add to the sense of slowdown in the economy. New Zealand unemployment for Q1 is expected to decline to 5.5% from 5.7% but much of that may be due to an expected decline in the participation rate, so I’m not sure whether it will boost NZD.
The Market
EUR/USD continues its pullback
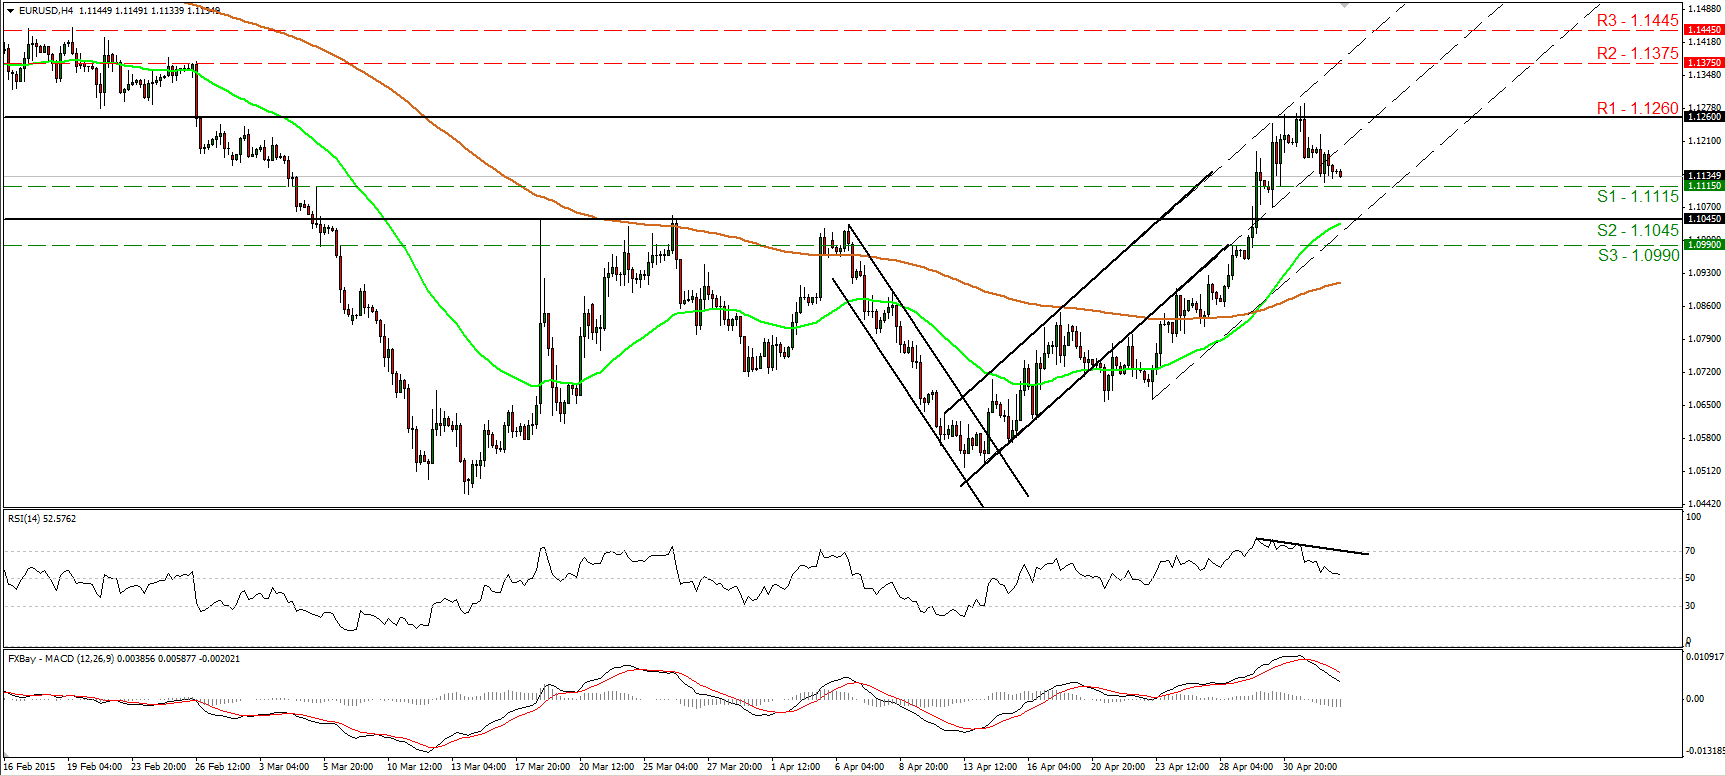
EUR/USD continued its slide on Monday and is currently trading slightly above the 1.1115 (S1) support line. The short-term picture stays positive in my view, but I prefer to wait for a clear close above the 1.1260 (R1) zone before I get more confident on the upside. Such a break could set the stage for extensions towards our next obstacle of 1.1375 (R2), marked by the peak of the 26th of February. Nevertheless, bearing in mind our momentum studies, I would stay mindful that further retreat could be in the works. The RSI headed towards its 50 line after exiting its overbought territory, while the MACD stands below its trigger and points south. A move below 1.1115 (S1) would probably confirm the continuation of the pullback and perhaps challenge the key zone of 1.1045 (S2) as a support this time. On the daily chart, the break above 1.1045 (S2) signaled the completion of a possible double bottom formation, something that could carry larger bullish implications.
• Support: 1.1115 (S1), 1.1045 (S2), 1.0990 (S3).
• Resistance: 1.1260 (R1), 1.1375 (R2), 1.1445 (R3).
AUD/USD triggers buy orders slightly below 0.7800 following the RBA decision
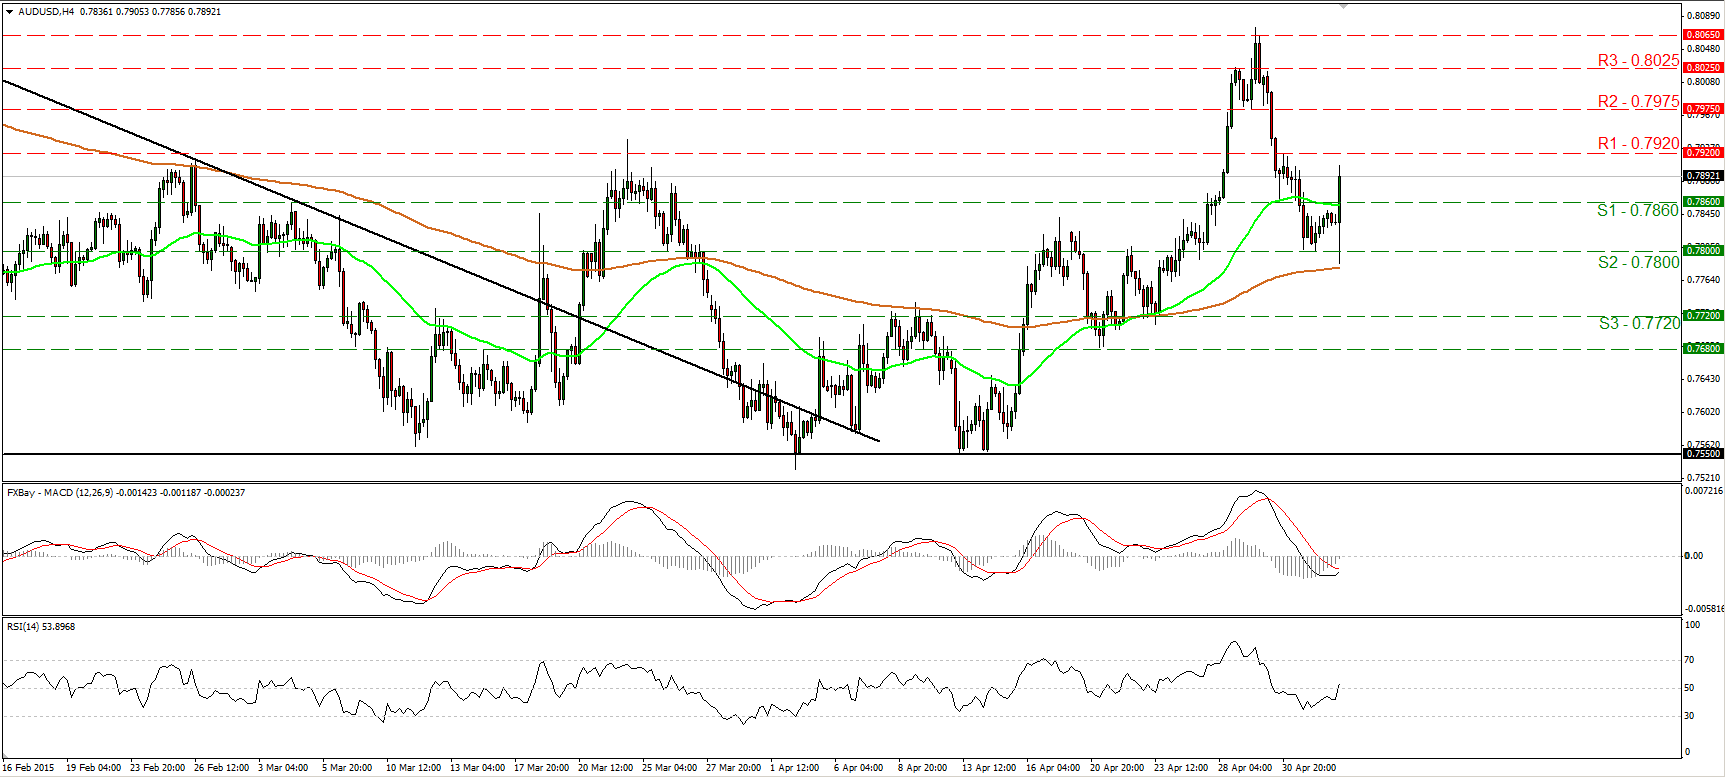
AUD/USD tumbled during the European morning Tuesday after the Reserve Bank of Australia cut its benchmark interest rate by 25bps as expected. However, the pair triggered some buy orders slightly below our support line of 0.7800 (S2) and surged to break above the resistance (now turned into support) barrier of 0.7860 (S1). I would now expect the rate to challenge our next resistance obstacle of 0.7920 (R1), where a break is likely to extend the rally towards the 0.7975 hurdle (R2). Our short-term oscillators support the notion. The RSI rebounded and emerged above its 50 line, while the MACD has bottomed and could move above its trigger line soon. The rebound from around 0.7800 (S2) could confirm a higher low on the daily chart, and keep the medium term picture somewhat positive.
• Support: 0.7860 (S1), 0.7800 (S2), 0.7720 (S3).
• Resistance: 0.7920 (R1), 0.7975 (R2), 0.8025 (R3).
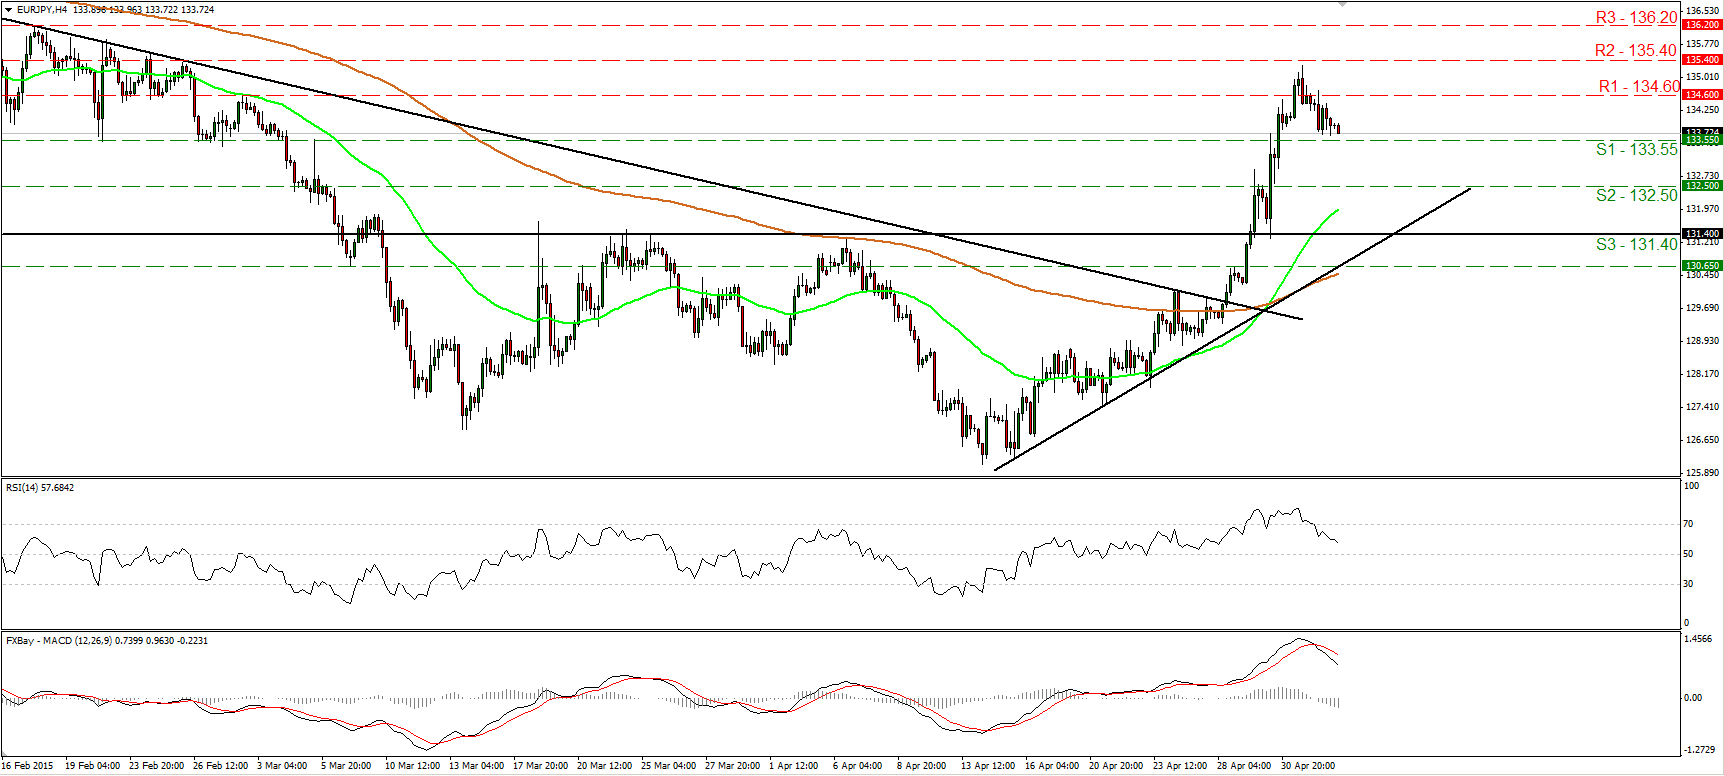
EUR/JPY hits resistance around 135.40 and pulls back
EUR/JPY started sliding after hitting resistance fractionally below 135.40 (R2). Currently the rate is trading above 133.55 (S1), where a clear break could signal the continuation of the tumble and perhaps target our next support line, at 132.50 (S2). Our momentum indicators corroborate my view that the slide is likely to continue. The RSI moved lower after exiting its overbought zone, while the MACD has topped and fallen below its signal line. Nevertheless, the rate is still trading well above the short-term uptrend line taken from back the low of the 15th of April and this keeps the short-term trend positive. I would treat any possible setbacks as a corrective move before the next positive leg. On the daily chart, the break above 131.40 (S3) confirmed the positive divergence between our daily oscillators and the price action and signaled a forthcoming higher high. Therefore, I believe that the medium term picture has also turned positive.
• Support: 133.55 (S1), 132.50 (S2), 131.40 (S3).
• Resistance: 134.60 (R1), 135.40 (R2), 136.20 (R3).
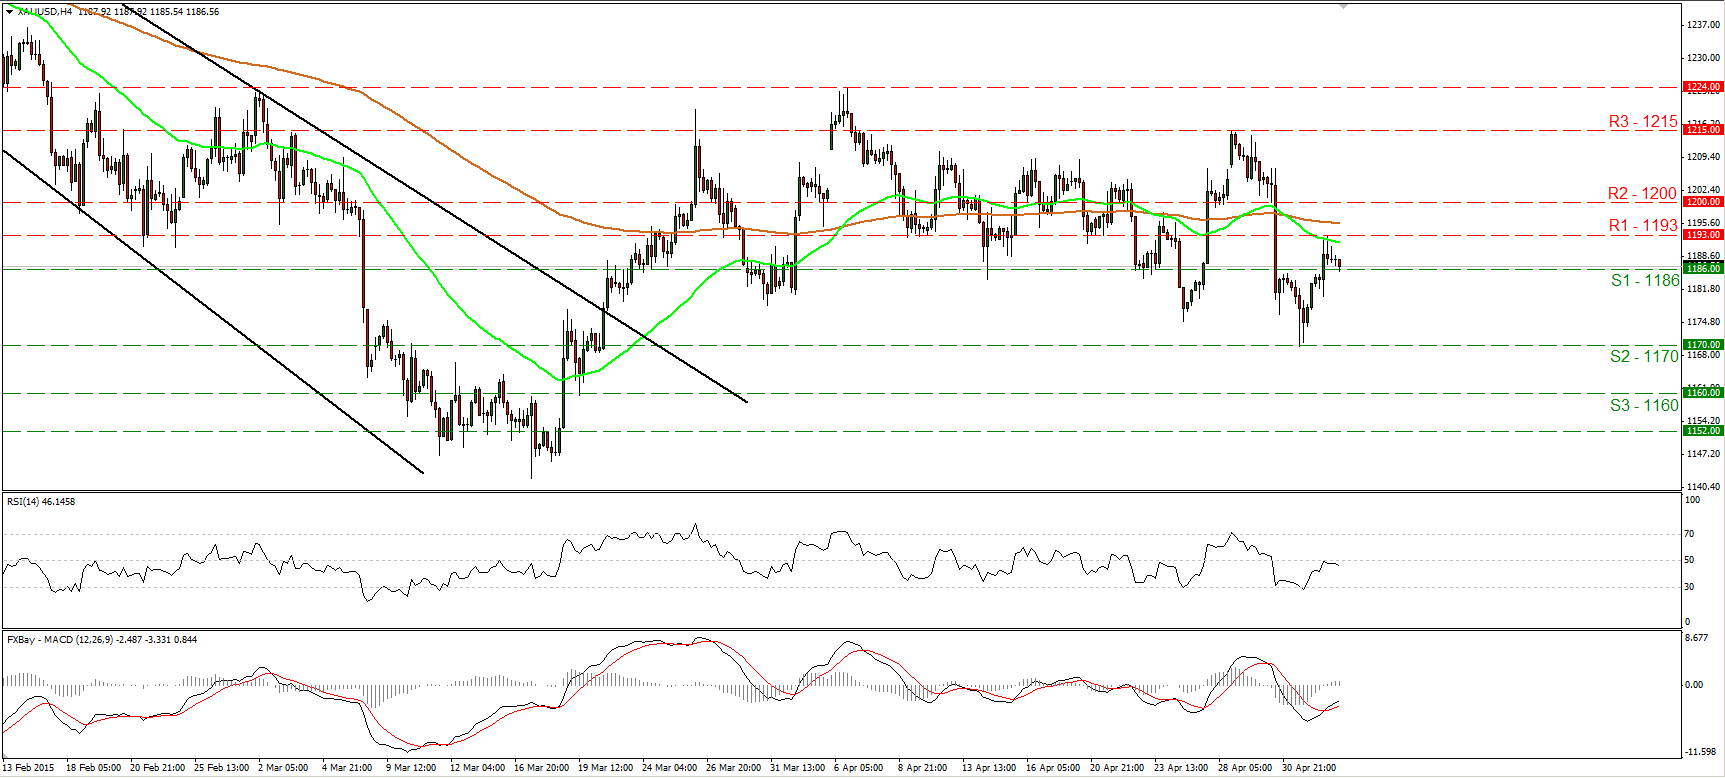
Gold trades somewhat higher
Gold traded somewhat higher on Monday, but hit resistance at 1193 (R1) and then retreated somewhat. Bearing in mind that the MACD has bottomed and crossed above its trigger, while the RSI edged higher, towards its 50 line, I still expect the metal to trade higher and perhaps challenge the psychological figure of 1200 (R2). Although the rebound may continue, with no clear trending structure on the 4-hour chart, I maintain my view that the outlook is neutral. On the daily chart, both our short-term oscillators gyrate around their equilibrium lines, confirming the trendless short-term picture.
• Support: 1186 (S1), 1170 (S2), 1160 (S3).
• Resistance: 1193 (R1), 1200 (R2), 1215 (R3).
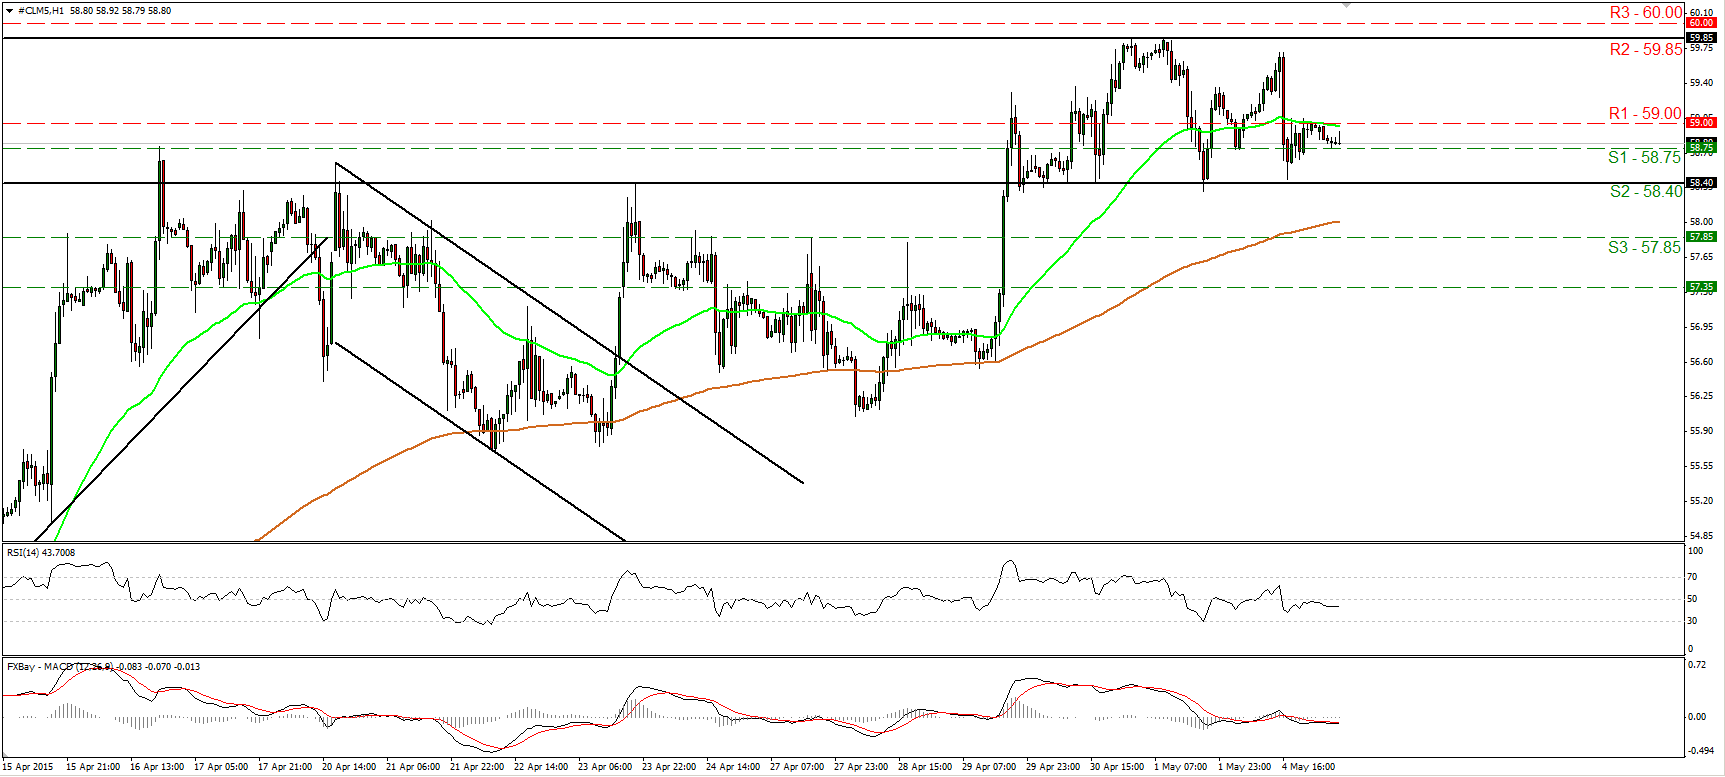
WTI tumbles and hits support near 58.40 again
WTI fell yesterday, but hit support around 58.40 (S2) again and then rebounded. WTI is trading between that key support line and the resistance of 59.85 (R2) since the 29th of April, therefore I would consider the short-term bias to be neutral. The trendless mode is also supported by our hourly oscillators. Both the 14-hour RSI and the hourly MACD oscillate around their equilibrium lines. On the daily chart, I still see a positive medium term outlook. The break above 55.00 on the 14th of April signalled the completion of a double bottom formation, something that could carry larger bullish implications in the not-too-distant future. However, I see negative divergence between both our daily momentum studies and the price action, hinting that a corrective move could be looming before buyers pull the trigger again.
• Support: 58.75 (S1), 58.40 (S2), 57.85 (S3).
• Resistance: 59.00 (R1) 59.85 (R2), 60.00 (R3).

