Greece: the end of the road?
It looks like the end of the Greek drama is rapidly approaching. Reuters quoted Greek finance officials as saying that the country will need to tap all the remaining cash reserves across its public sector -- a total of EUR 2bn -- to pay civil service wages and pensions at the end of the month. That leaves no money to repay the IMF or refinance maturing T-bills in May.
Over the weekend, senior European officials said that while the Greek debt situation was dire, they still believed an agreement would be reached, according to the New York Times (NYT). However, it was hard to see the outlines of that agreement even now. “We still do not have a comprehensive, detailed plan,” one of Greece’s senior-most creditors said. “Plus, the numbers just don’t add up.”
The markets were reassured a few weeks ago when Finance Minister Varoufakis flew to Washington to meet with IMF President Lagarde. At that time he said publicly that Greece intended to meet its obligations. The statement was taken as a commitment by Greece to do whatever it takes to pay the IMF and thereby avoid an official default. The NYT reported that privately, however, Mr. Varoufakis told colleagues in Washington that he purposely used the word “intend” instead of “will,” meaning that it is possible that they might not pay.
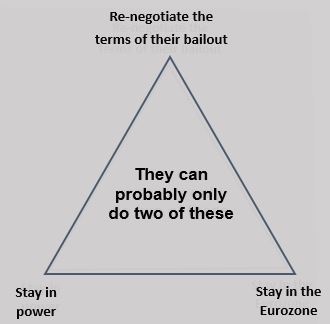
Greece's deputy prime minister Yiannis Dragasakis Sunday refused to rule out the possibility of new elections or a referendum if talks with its creditors remained deadlocked. Personally, I think this looks like the most likely result. The administration is trapped in a “impossible trinity” in which it is trying to do three things, only two of which are possible: renegotiate the debt, remain in the euro and stay in office. The only way out that I can see is to put together a proposal that will meet the requirements of the creditors, take it to the voters, and ask them which do you prefer: this or leave the euro?
According to the Greek newspaper Kathimerini, “At this point, the administration looks as if it is trying to buy more time for negotiations by mobilizing all available resources. Some say the goal may be to include the pending reforms in a new, more attractive agreement, containing debt relief measures. The government could take this deal to the people via a referendum or even call new elections. All in all, the government’s strategy is not clear to the market and others.”
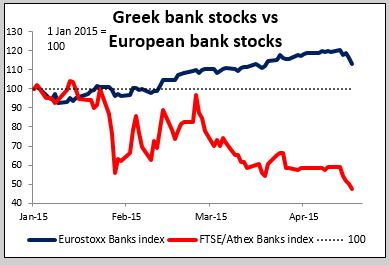
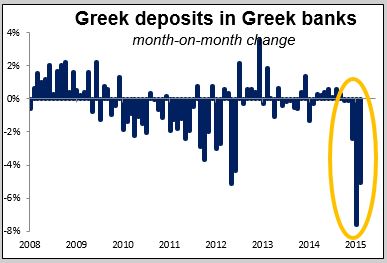
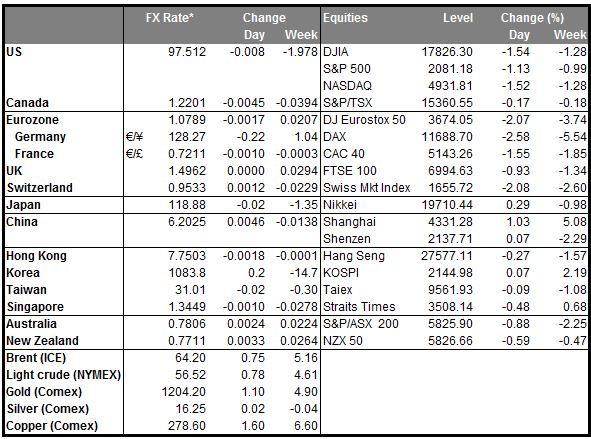
In any event, it’s clear that the Greek problems are starting to impact other markets. The DAX was down 2.6% on Friday as Greek bank stocks continued their collapse. These stocks were not so high before and they lost about 20% last week alone! The problem is the large decline in Greek domestic bank deposits (down EUR 25.4bn or 14.3% in the last three months) has in effect been funded by the other central banks of the eurozone through the ECB’s payment system and shows up as a growing asset on their balance sheets. That asset will have to be written down if Greece leaves the eurozone, in addition to the ECB’s shared exposure to Greek bonds. In other words, there definitely would be repercussions across the eurozone. I expect the Greek problem to be one of the main themes in financial markets this week.
China cuts RRR The People’s Bank of China (PBOC) cut the reserve requirement ratio over the weekend for the second time this year. The move is not a huge surprise, given the slowdown in the economy. Moreover, one of the main reasons why China has such a high RRR (now 18.5%) is in order to sterilize the nation’s FX market intervention, but now that it’s no longer intervening to weaken the currency, this sterilization is less necessary. AUD gapped higher at the opening on the news, but in my view the move is a reaction to the slowdown that’s already happened and not a harbinger of higher growth to come. The tepid response in the stock market (up 1%) suggests that domestic investors are happy but not overjoyed. Thus the rally in AUD is likely to prove only temporary, in my view.
NZ inflation falls New Zealand’s prices fell at an accelerating pace on a qoq basis in Q1and were almost unchanged yoy. There was little impact on the currency however.
Today’s highlights: There is little on the schedule today. In the US, the Chicago Fed national activity index for March is expected to improve.
ECB’s Constancio speaks at the European Parliament in Brussels, while New York Fed President Dudley speaks on the economy and policy in New York, and later in the day, RBA Gov. Stevens will deliver a speech in New York.
This week: The main focus this week should in theory be the European finance ministers’ meeting Friday, when they are supposed to take a decision on the Greek reform proposals that are supposed to be submitted today. However since the proposals will probably not be submitted, they will have nothing to vote on. Still, the markets will be waiting to hear their comments, if any, on the situation.
As for indicators, the big day will be Thursday, when the April PMIs for the major countries are announced. This is as usual the first data for the current month every month and so sets the tone. The HSBC (LONDON:HSBA) PMI is expected to fall further into contractionary territory. Following the disappointing Chinese industrial production for March, that could be bad for AUD and NZD.
There are no central bank meetings this week, but we do get the minutes of two recent meetings. On Tuesday, Reserve Bank of Australia releases the minutes from its latest policy meeting of April 7th. We may get more clarification on the Bank’s decision to maintain its benchmark rate at 2.25% even though in the statement officials said that “further easing of policy may be appropriate over the period ahead”. We could also get more hints about what they think the appropriate level for Aussie is. On Wednesday the BoE releases the minutes of its latest meeting. It’ll be interesting to see the view of Bank officials now that the inflation rate is at zero. The minutes from the previous meeting showed that two of the nine members thought the decision to hold rates steady in March was “finely balanced.” What do they think now?
The biggest US indicator of the week is probably durable goods orders for March on Wednesday. The big thing would be if nondefense capital goods excluding aircraft orders, referred to as “core capital goods orders,” managed to rise after falling for seven of the last eight months. A rise would be seen as the possible start of a turnaround in business investment and would be considered very bullish for the dollar. We also get existing home sales for March on Wednesday and new home sales on Thursday.
Aside from the PMIs, the other big eurozone indicators during the week are the ZEW survey for April on Tuesday and the Ifo index on Friday. For the ZEW survey, both the current situation and expectation indices have been climbing higher since November. This could be the 6th consecutive month of an increase, which would confirm the firming momentum of Germany’s economic recovery. But even if this is the case, I would expect any EUR/USD rebounds to be short-lived and provide renewed selling opportunities.
The only major UK indicator next week is retail sales for March on Wednesday. The headline figure is expected to show a rise again, although not as big as in February. In any event, I wonder if GBP is still going to move on economics or is it mostly political concerns as we near the election.
On Wednesday, we get Australia’s CPI data for Q1. New Zealand CPI came in lower than expected on Monday and it had little impact on the market; I wonder if the Australian CPI will have as much impact as usual.
The Market
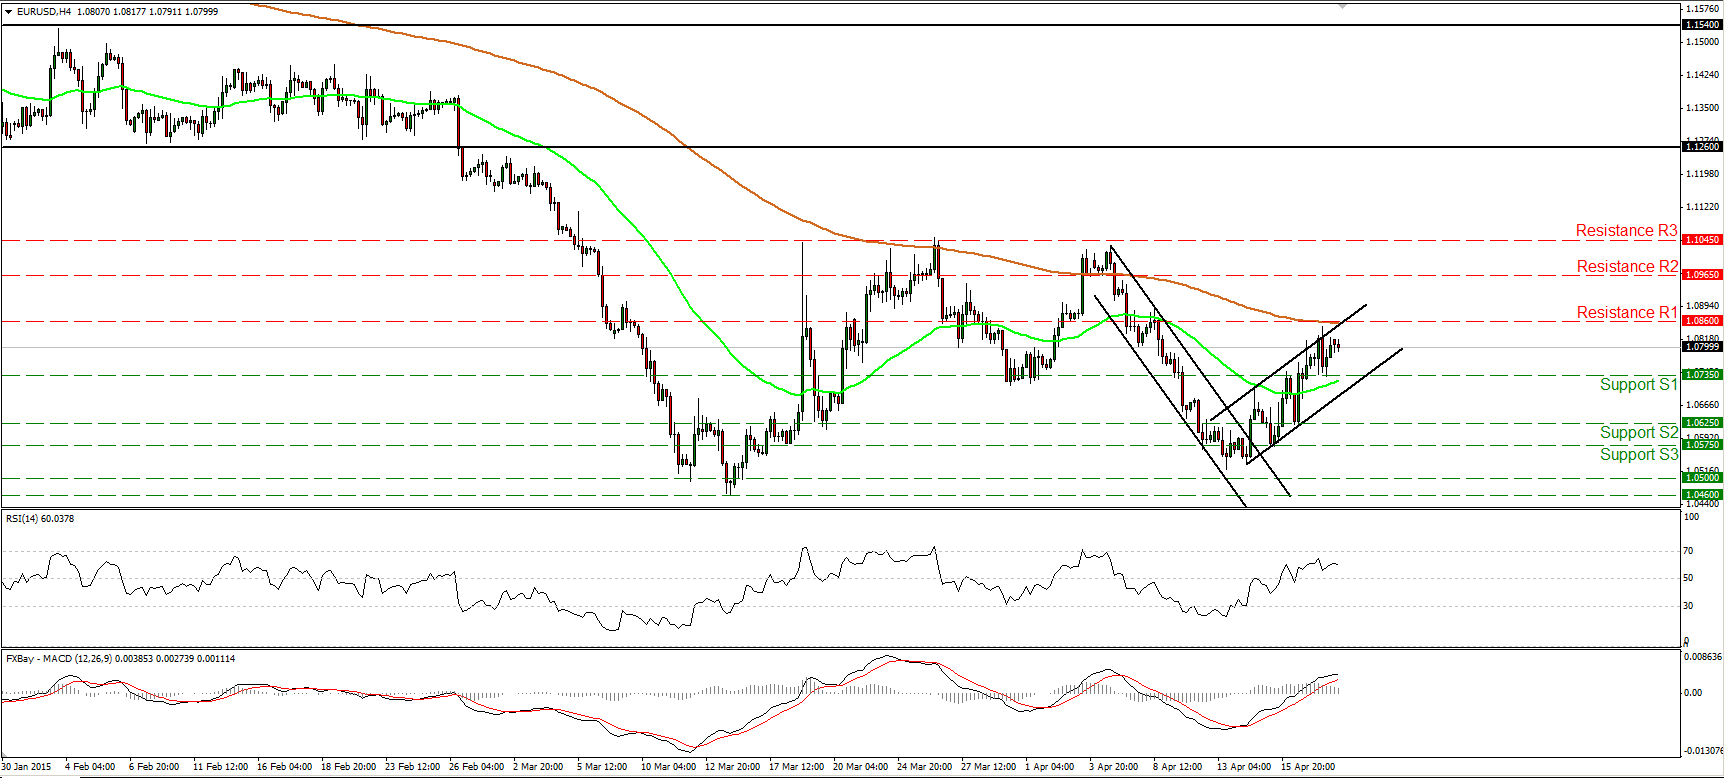
EUR/USD hits resistance slightly below 1.0860
EUR/USD traded somewhat higher on Friday, but hit resistance marginally below the 1.0860 (R1) line and the 200-period moving average, and pulled back. As long as the rate is trading within the near-term upside channel, the short-term bias remains to the upside in my view. This is also supported by our daily oscillators. The 14-day RSI is now testing its 50 line and could move above it soon, while the MACD, although negative, has crossed again above its trigger line. However, given our proximity to the upper bound of the upside channel, I would be careful that a pullback could be in the works. In the bigger picture, EUR/USD is still trading below both the 50- and the 200-day moving averages. However, a clear close below 1.0460 is needed to confirm a forthcoming lower low and trigger the resumption of the larger downtrend. On the other hand, a close above 1.1045 (R3) could signal the completion of a double bottom and perhaps set the stage for larger bullish extensions.
• Support: 1.0735 (S1), 1.0625 (S2), 1.0575 (S3).
• Resistance: 1.0860 (R1), 1.0965 (R2), 1.1045 (R3).
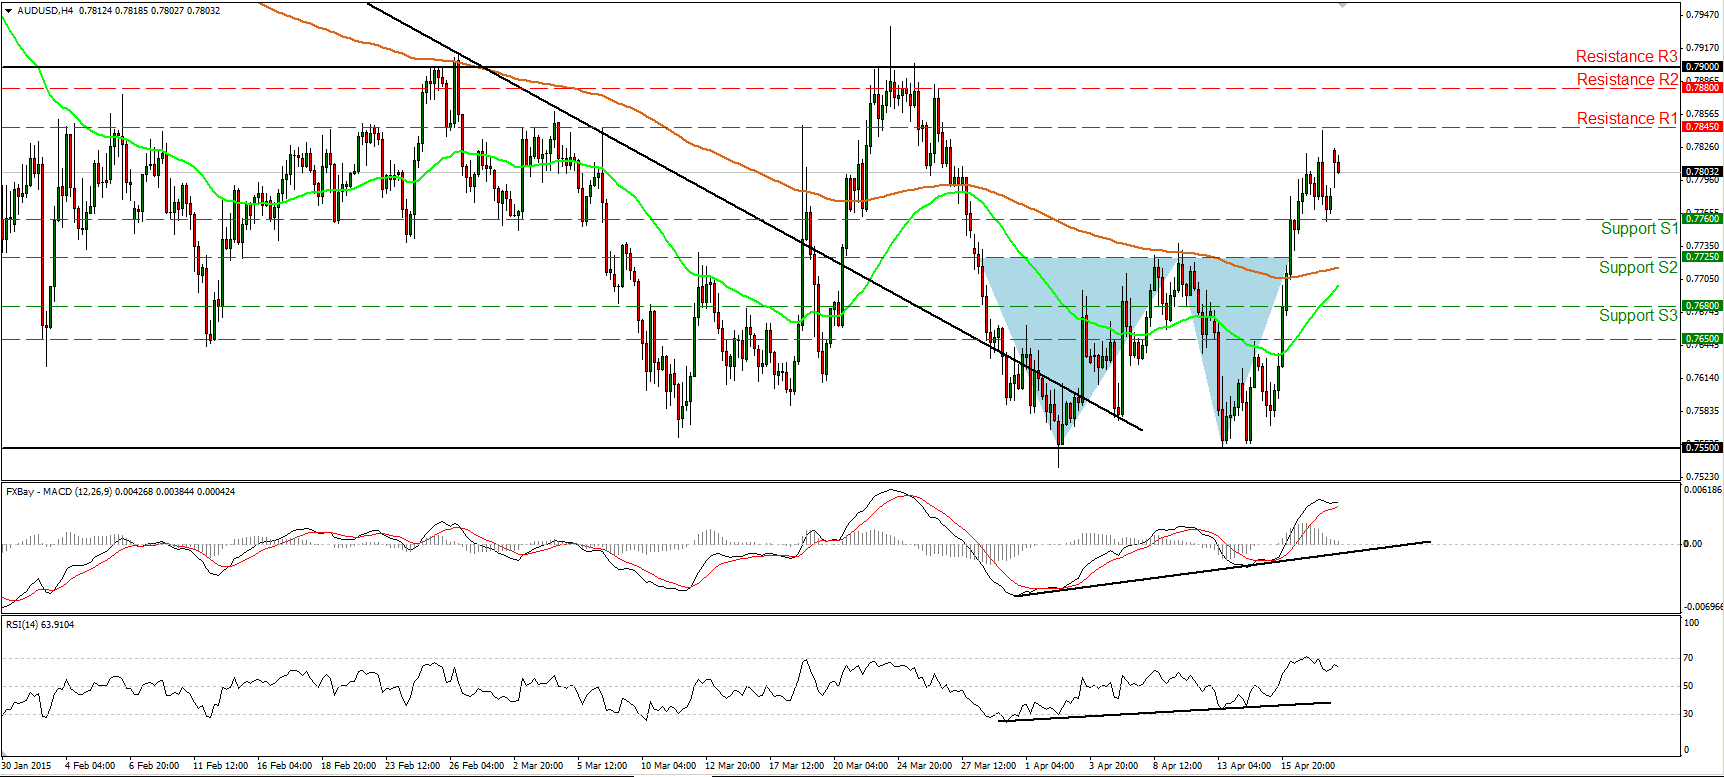
AUD/USD gaps up after China’s reserve ratio cut
AUD/USD gapped higher on Monday, after the People’s Bank of China lowered its reserve-requirement ratio during the weekend. Having in mind that the break above 0.7725 (S2) signaled the completion of a double bottom, I would consider the short-term bias to stay to the upside. I believe that a clear move above 0.7845 (R1) is likely to target our next resistance at 0.7880 (R2). Nevertheless, taking a look at our short-term oscillators, I would be careful of a possible pullback before buyers seize control again, perhaps to test the 0.7760 (S1) support line. The RSI hit resistance at its 70 line and turned down, while the MACD has topped and could move below its trigger any time soon. Although I believe we are likely to experience further upside extensions in the near term, I maintain my neutral view as far as the overall outlook is concerned. First, the rate has been oscillating between 0.7550 and 0.7900 (R3) since the end of January, and second, there is still positive divergence between our daily momentum indicators and the price action.
• Support: 0.7760 (S1), 0.7725 (S2), 0.7680 (S3).
• Resistance: 0.7845 (R1), 0.7880 (R2), 0.7900 (R3).
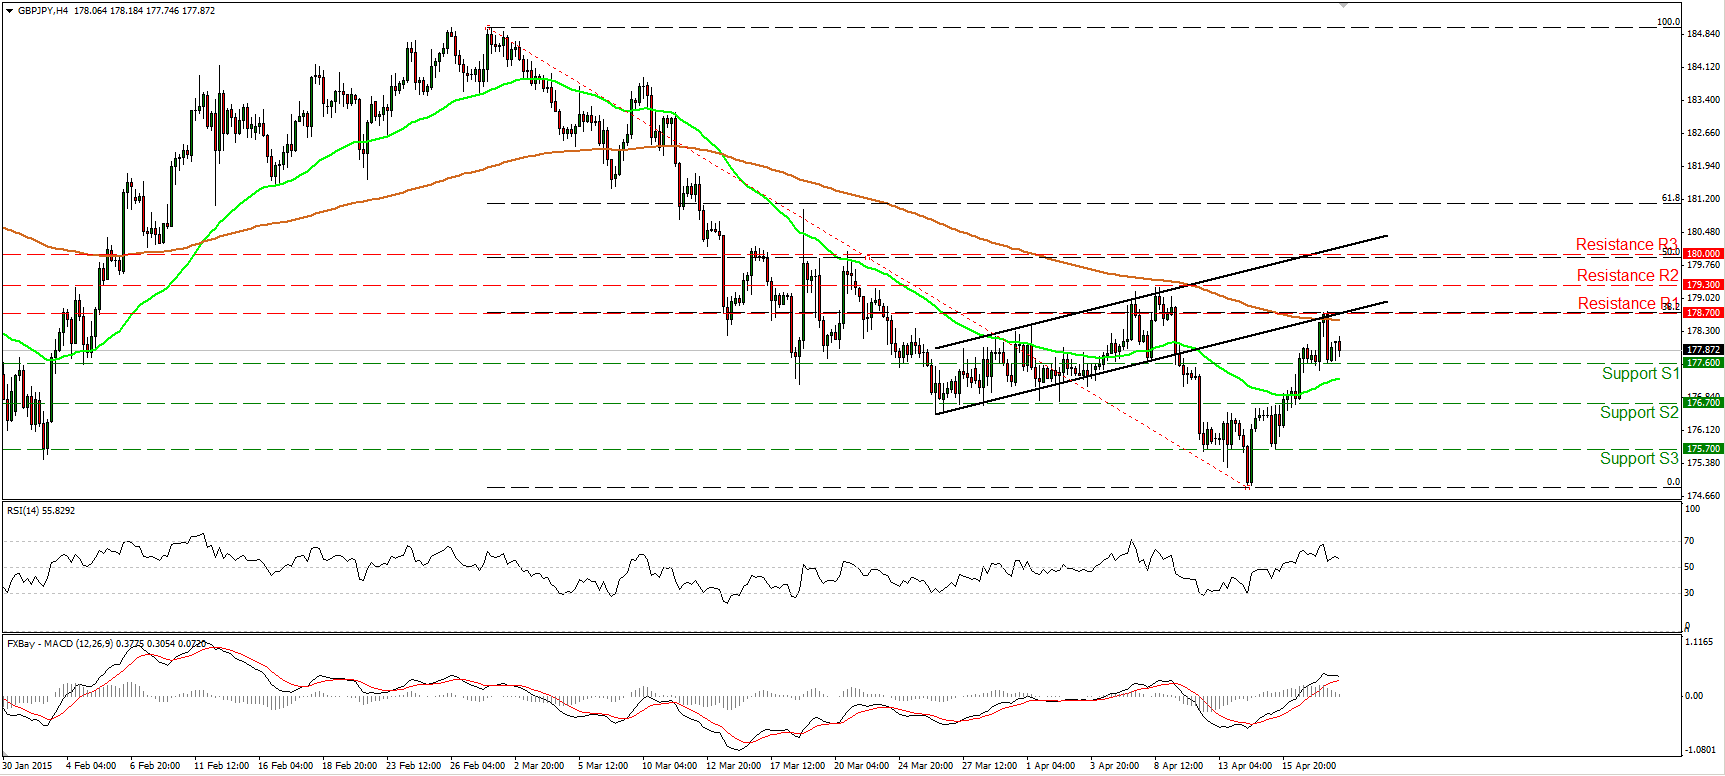
GBP/JPY finds resistance at 178.70
GBP/JPY traded lower after hitting resistance at the 178.70 (R1) line, which happens to be the 38.2% retracement level of the 27th of February – 14th of April decline. The rate is now trading near the support line of 177.60 (S1), where a break could pave the way for our next support at 176.70 (S2). Our short-term oscillators amplify the case for something like that. The RSI hit resistance marginally below its 70 line and turned lower, while the MACD shows signs of topping and that it could move below its trigger line soon. As for the bigger picture, the rate is now trading back near the 200-day moving average. I would like to see a clear and decisive daily close below the 175.70 (S3) line to turn the overall outlook negative. Such a move could complete a 5-month failure swing top.
• Support: 177.60 (S1), 176.70 (S2), 175.70 (S3).
• Resistance: 178.70 (R1), 179.30 (R2), 180.00 (R3).
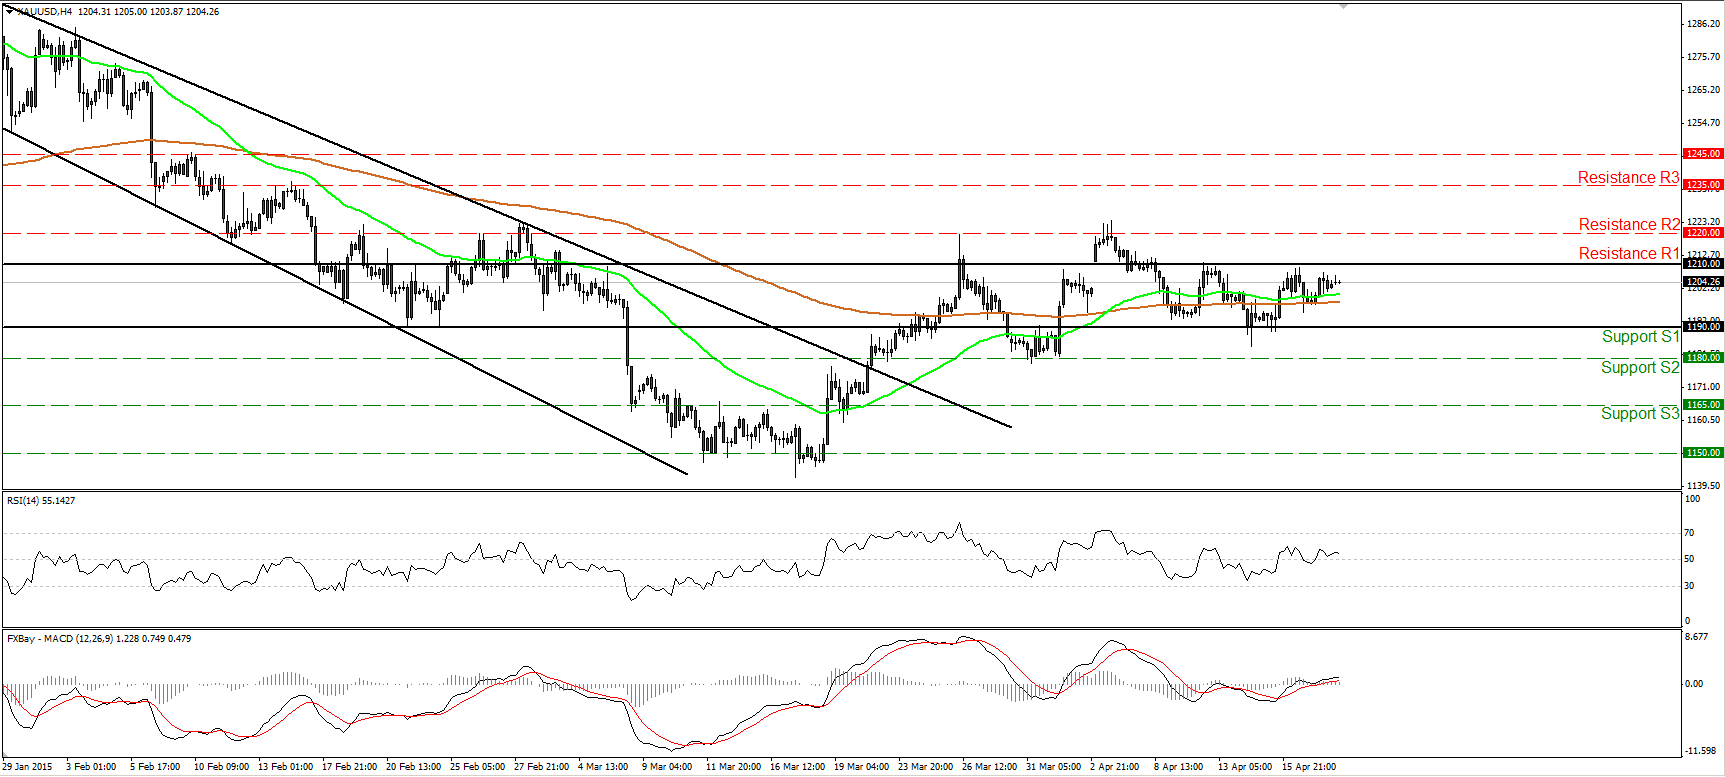
Gold continues sideways
Gold traded somewhat higher on Friday, staying between the support of 1190 (S1) and the resistance of 1210 (R1). Therefore, I would consider the short-term picture to be neutral for now. The 50- and 200-period moving averages both point east, supporting the notion. A move below 1190 (S1) is needed to shift the bias back to the downside and perhaps trigger extensions towards our next support at 1180 (S2). On the daily chart the price is still trading below the 50% retracement level of the 22nd of January - 17th of March decline. This still makes me believe that the 17th of March – 06th of April recovery was just a corrective move. However, I would prefer to see a clear close below 1180 (S2) to get confident on the downside again.
• Support: 1190 (S1), 1180 (S2), 1165 (S3).
• Resistance: 1210 (R1), 1220 (R2), 1235 (R3).
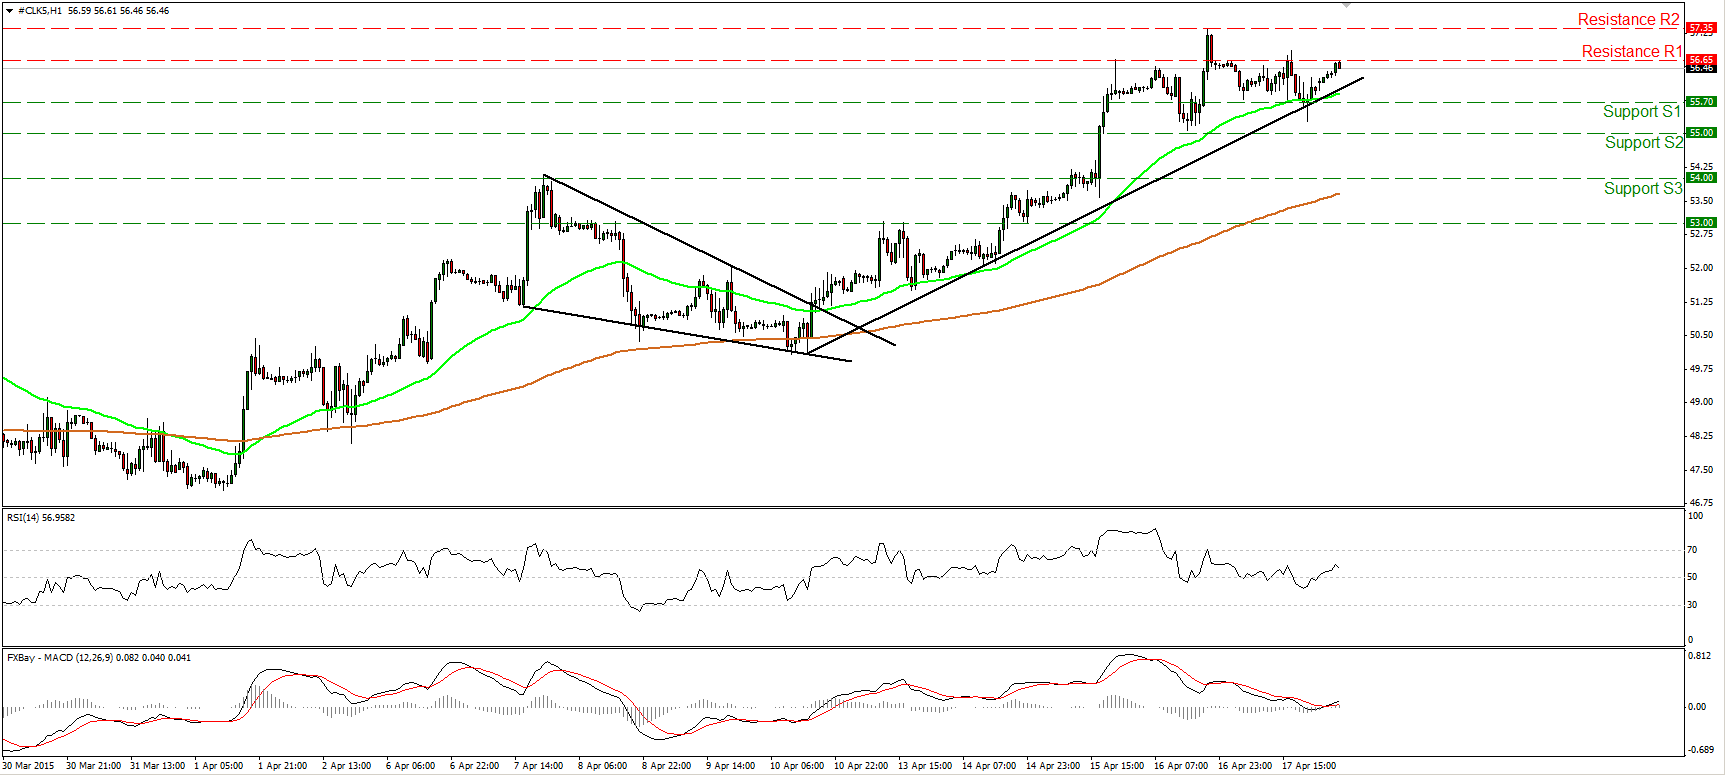
WTI stays above 55.00
WTI traded sideways on Friday, and today during the early European morning, it is testing the resistance line of 56.65 (R1). Given that the price is trading above the short-term uptrend line taken from the lows of the 10th of April, I believe that the short-term picture remains positive. A move above 56.65 (R1) would aim for another test at the next resistance of 57.35 (R2). Our daily oscillators detect bullish momentum and support the short-term trend. The 14-day RSI continues higher and is getting closer to its 70 line, while the daily MACD lies above both its trigger and zero lines, pointing north. In my opinion, the break above 55.00 (S2) signalled the completion of a double bottom formation on the daily chart, something that could carry larger bullish implications.
• Support: 55.70 (S1), 55.00 (S2), 54.00 (S3).
• Resistance: 56.65 (R1) 57.35 (R2), 58.50 (R3).

