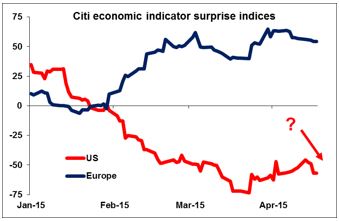
Weak US data hits USD The dollar bulls were assuming that the US economic data would improve along with the weather, but so far that doesn’t seem to be happening, at least not uniformly. The range of forecasts for US housing starts was unusually wide and yet all 80 economists missed – the figure came in below the lowest forecast. Building permits missed expectations as well. This was despite the fact that March temperatures were average or above average in most of the country, so there should have been a relatively strong number after the sharp fall in February. Jobless claims were also above consensus, but it’s more important to watch the four-week moving average owing to the Eastern holiday. That was nearly unchanged. The Philadelphia Fed index rose more than expected, however.
Oil prices rally Oil prices fell during the European day on news that Saudi Arabia had expanded its output dramatically during March to the highest it’s been in three decades. It appears that the Kingdom really wants to keep the financial pressure on US firms (and Russia?) in order to push them out of business. But prices came back later in the day after Al Qaida captured an oil terminal in Yemen that exports an average of 120,000 to 140,000 b/d. I expect Saudi Arabia wants to keep oil prices depressed so I don’t think rally has much further to go.
Fed views mixed; market moves to easier Fed Vice Chair Stanley Fischer was fairly hawkish yesterday. He downplayed the recent weak NFP figure, saying that “there’s one weak employment report and five or six spectacular ones before it” and saying that he expects the Fed to start hiking rates this year. Cleveland Fed President Mester, a non-voter, said the economy was near full employment and she “would be comfortable with liftoff relatively soon” if the data show growth regaining momentum. But other officials were less certain. Atlanta Fed President Lockhart said he wanted to see “more confirming evidence” and that he would prefer “a later liftoff date,” while Boston Fed President Rosengren, a non-voter, said that data would have to improve in order to meet the Fed’s conditions for raising rates. The market’s verdict? Fed funds rate expectations down 3.5 bps and 5yr Treasury yields slightly lower. That also helped to weaken the dollar.
Greece bonds blow up Greek debt has blown up in the last couple of days – the spread of 5yr bonds over Germany is up 284 bps in just 3 days, over 100 bps just yesterday, even while 9-year Bund dip their toes into negative territory. Why? In fact nothing’s happening, but that’s just the problem. Greece doesn’t have enough time to do nothing. Negotiations between the technical teams in Athens only just restarted yesterday following the Easter break and the Troika will reportedly reconvene today. Greek PM Tsipras said he is “firmly confident” that his country will reach a deal with creditors by the end of April and highlighted several points of agreement: tax collection, corruption and redistributing the tax burden. But he also conceded that the two sides disagreed on four major issues: labor rules, pension reform, VAT and privatizations. So more areas of disagreement than agreement even at this late hour. The creditor side was more blunt: the headline in yesterday’s FT was “Nobody expects a solution, says Schauble”. Greece was supposed to present its reform proposals on Monday so that they could be considered at a meeting of the Eurozone finance ministers on Thursday, although the Thursday deadline seems to have been put off till the next meeting on May 11th. But with a EUR 747mn payment to the IMF due on May 12th, a meeting on the 11th may be too late to unlock the funds necessary to keep Greece from defaulting.

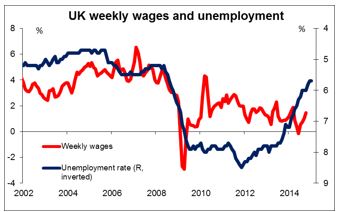
Today’s highlights: The UK unemployment rate for February is forecast to have ticked down to 5.6% from 5.7% in the preceding month, while average weekly earnings are expected to have risen at the same annual pace as previously (+1.8% yoy). Bearing in mind that the inflation rate declined to 0.0%, a steady increase in nominal wages implies an acceleration in real wages. This, accompanied by a decline in the unemployment rate, could support the pound.
Eurozone’s final CPI data for March are coming out. As usual, they are expected to confirm the preliminary figures.
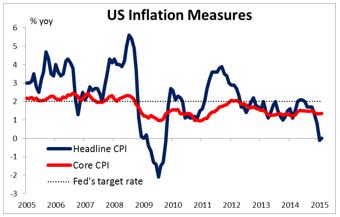
In the US, both the headline and core CPI rates for March are expected to have remained unchanged at 0.0% yoy and +1.7% yoy respectively. Since the core rate stands near the Fed’s target of 2.0%, this suggest that the low energy prices are the main reason behind the low headline figure. The Fed has said that this is just a transitory effect, and so it may look through it. Therefore the impact on USD is likely to be minimal. The recent rise in oil prices makes it likely that headline CPI could show a rise in April. The preliminary University of Michigan consumer sentiment index for April is expected to tick up from the previous month. The surveys of 1-year and 5-to-10 year inflation expectation outlook are also coming out.
We get the March CPI data from Canada as well. Both the headline and the core rates are forecast to have remained unchanged. A positive surprise and a further rise in oil prices could add to the positive sentiment towards CAD following the optimistic monetary policy statement on Wednesday. The nation’s retail sales for February are also coming out and they are expected to have rebounded from January.
Two speakers are scheduled: ECB Governing Council member Jens Weidman and German Finance Minister Wolfgang Schaeuble speak at a press briefing.
The Market
EUR/USD hits resistance slightly above 1.0800
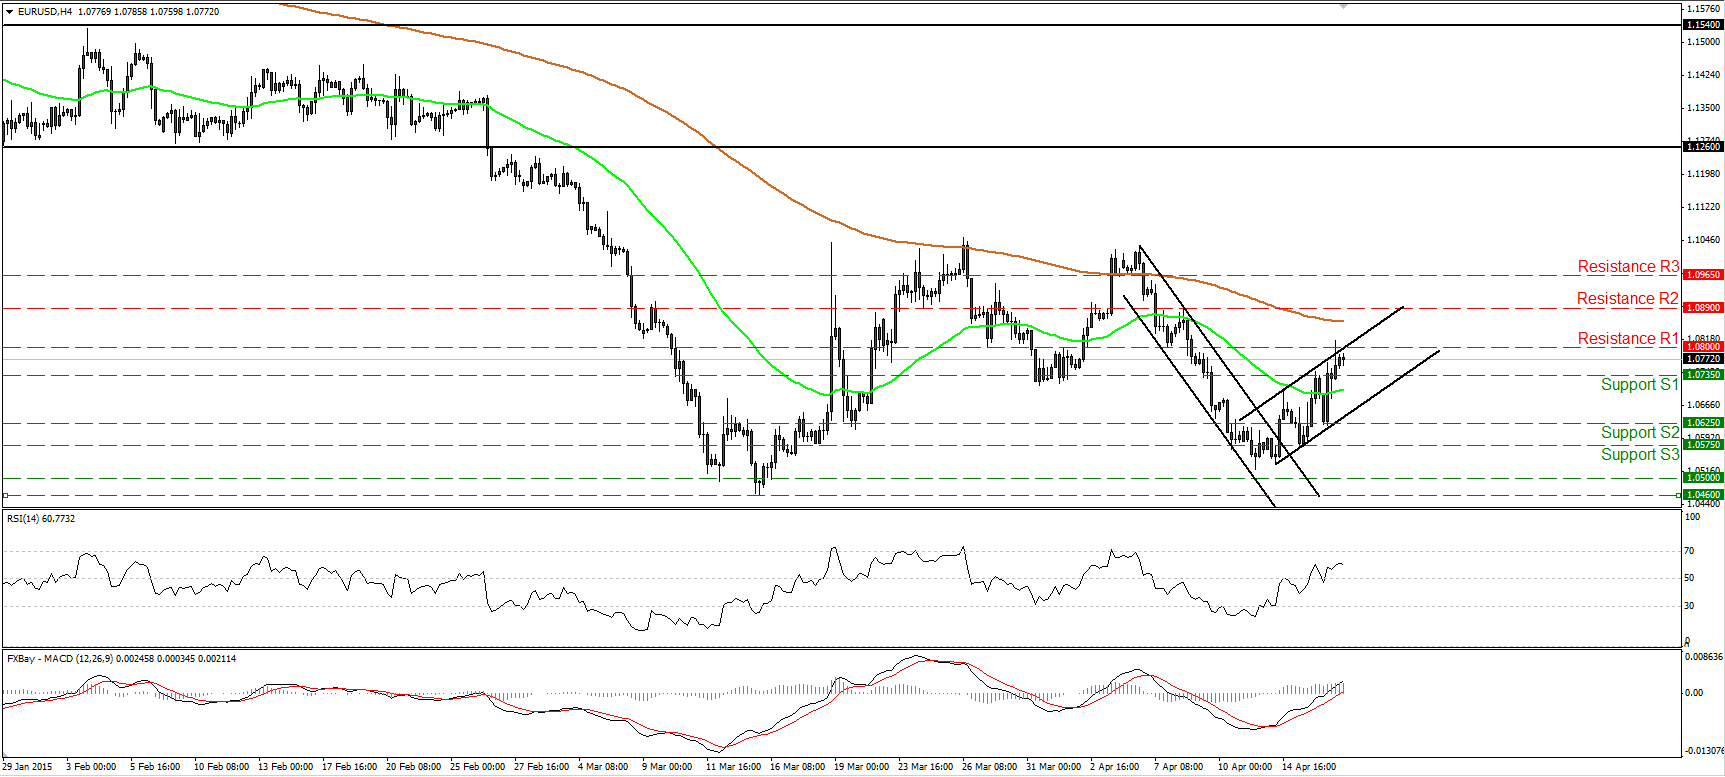
EUR/USD pulled back on Thursday, but after hitting support at 1.0625 (S2), it rebounded to break above 1.0735 (S1) and to hit resistance slightly above the 1.0800 (R1) barrier. As long as the rate is trading within the near-term upside channel, the bias remains to the upside in my view. This is also supported by our short-term oscillators. The RSI rebounded from near its 50 line, while the MACD, already above its trigger line, obtained a positive sign. However, given our proximity to the upper bound of a possible upside channel, I would be careful that a pullback could be in the works. In the bigger picture, EUR/USD is still trading below both the 50- and the 200-day moving averages. Therefore, I would treat any possible near-term advances as corrective moves of the larger downtrend. A clear close below 1.0460 will confirm a forthcoming lower low and trigger the resumption of the larger downtrend.
• Support: 1.0735 (S1), 1.0625 (S2), 1.0575 (S3).
• Resistance: 1.0800 (R1), 1.0890 (R2), 1.0965 (R3).
NZD/USD rally halted at 0.7700
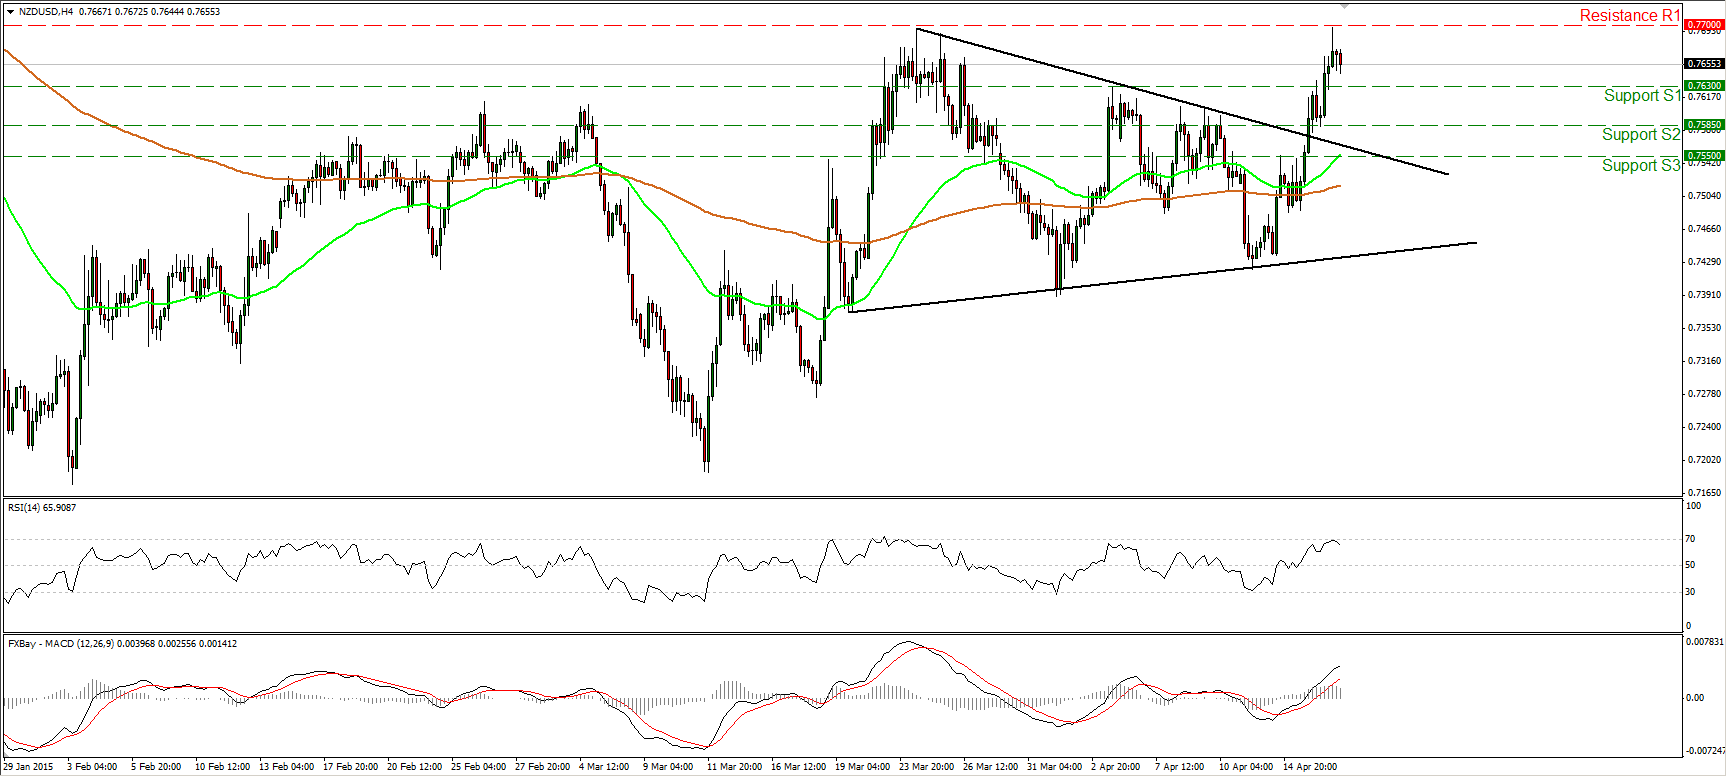
NZD/USD surged on Thursday, breaking above the resistance (now turned into support) of 0.7630 (S1). However, the advance was halted by the resistance of 0.7700 (R1) and the rate retreated somewhat. Taking into account that on the 15th of April, the rate exited a possible triangle formation, I would consider the short-term bias to be positive. A clear move above 0.7700 (R1) is likely to set the stage for larger upside extensions, perhaps towards our next resistance at 0.7785 (R2). Nevertheless, if we look at our short-term oscillators, I see signs of a possible corrective move before the next leg up. The RSI hit resistance at its 70 line and turned down, while the MACD, although positive, shows signs that it could start topping. On the daily chart, a close above 0.7700 (R1) could confirm a forthcoming higher high and perhaps turn the medium term picture positive.
• Support: 0.7630 (S1), 0.7585 (S2), 0.7550 (S3).
• Resistance: 0.7700 (R1), 0.7785 (R2), 0.7850 (R3).
EUR/GBP struggles near 0.7220
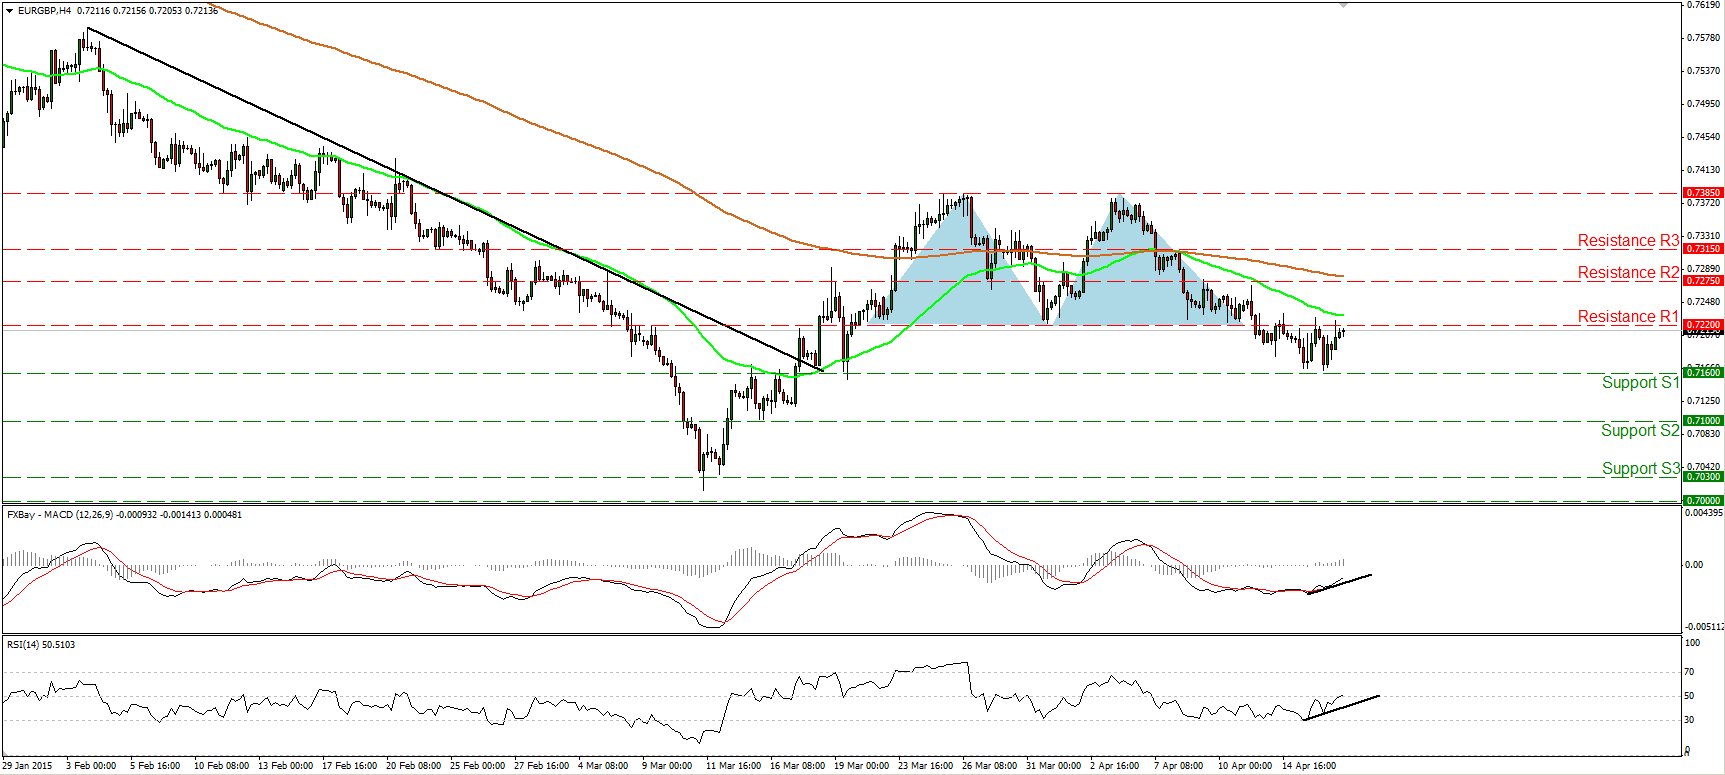
EUR/GBP traded in a consolidative manner, staying between the support line of 0.7160 (S1) and the resistance of 0.7220 (R1). The move below the 0.7220 (R1) hurdle on the 13th of April signaled the completion of a double top formation, so I believe that the short-term picture is cautiously negative. I would like to see a clear move below 0.7160 (S1) before getting confident again on the downside. Such a move is likely to pull the trigger for further declines, perhaps towards the 0.7100 (S2) territory. For now, I am a little bit worried that a minor bounce could be on the cards before the bears seize control again. The reason is because I see positive divergence between both our short-term oscillators and the price action. Moreover, the RSI is testing its 50 line and could move above it soon, while the MACD stands above its trigger, pointing north. On the daily chart, the completion of the aforementioned double top confirms that the 11th of March – 3rd of April recovery was just a 38.2% retracement of the 16th December – 11th of March decline, and that the overall downtrend is gaining momentum again.
• Support: 0.7160 (S1), 0.7100 (S2), 0.7030 (S3).
• Resistance: 0.7220 (R1), 0.7275 (R2), 0.7315 (R3).
Gold enters a sideways mode
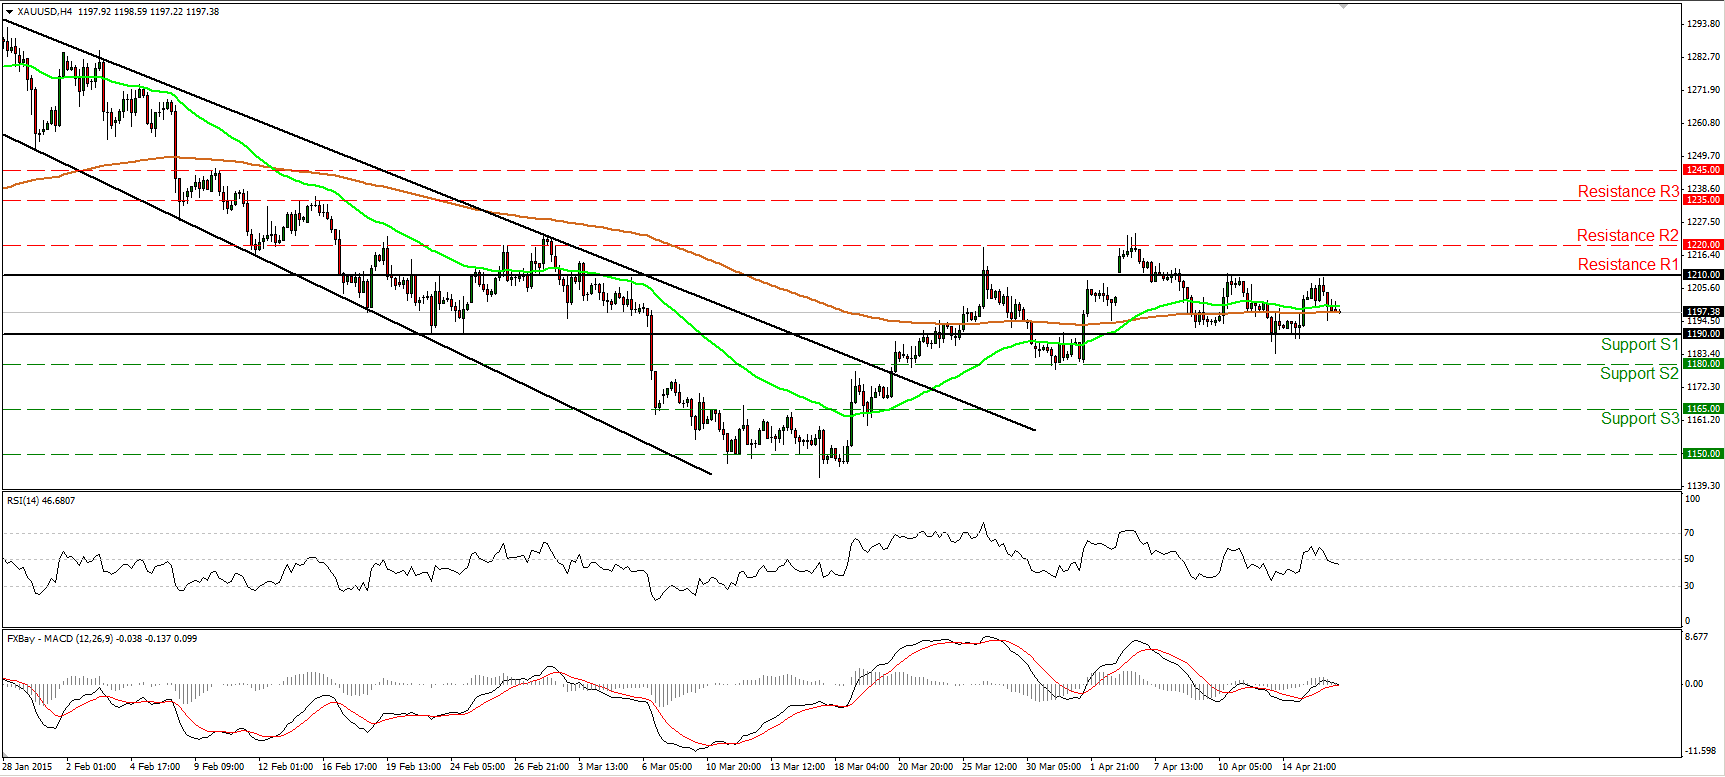
Gold traded lower on Thursday, after hitting resistance at 1210 (R1). I believe that now the metal has entered a sideways mode between that resistance and the support zone of 1190 (S1). Therefore, I would consider the short-term picture to be neutral for now. The 50- and 200-period moving averages both point east, supporting the notion. A move below 1190 (S1) is needed to shift the bias back to the downside and perhaps trigger extensions towards our next support at 1180 (S2). On the daily chart the price is still trading below the 50% retracement level of the 22nd of January - 17th of March decline. This still makes me believe that the 17th of March – 06th of April recovery was just a corrective move. However, I would prefer to see a clear close below 1180 (S2) to get confident on the downside again.
• Support: 1190 (S1), 1180 (S2), 1165 (S3).
• Resistance: 1210 (R1), 1220 (R2), 1235 (R3).
WTI hit resistance at 57.35 and pulls back
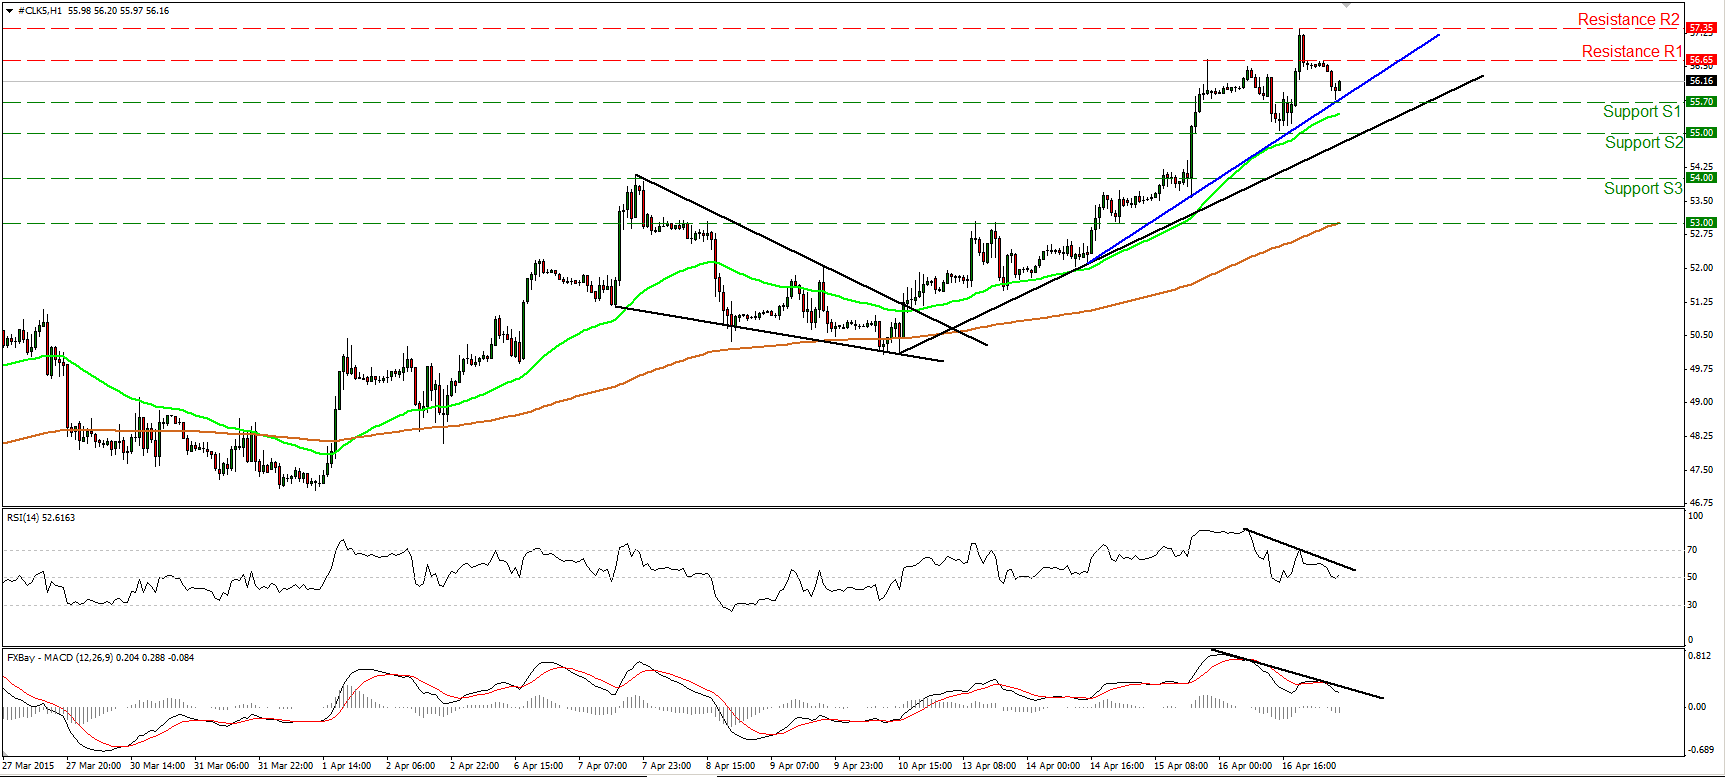
WTI continued to trade higher yesterday, but after hitting resistance at 57.35 (R2), it pulled back to sit on the minor-term blue uptrend line. I believe that the short-term picture remains positive, but given that there is negative divergence between both our hourly oscillators and the price action, I would be careful that a further pullback could be in the works. Therefore, I would prefer to stand aside and wait for price and momentum alignment. A decisive move above 57.35 (R2) could reinforce the short-term trend and perhaps aim for the high of the 22nd of December, at 58.50 (R3). Our daily oscillators detect bullish momentum and support the short-term trend. The 14-day RSI continues higher and is getting closer to its 70 line, while the daily MACD lies above both its trigger and zero lines, pointing north. In my opinion, the break above 55.00 (S2) signalled the completion of a double bottom formation on the daily chart, something that could carry larger bullish implications.
• Support: 55.70 (S1), 55.00 (S2), 54.00 (S3).
• Resistance: 56.65 (R1) 57.35 (R2), 58.55 (R3).
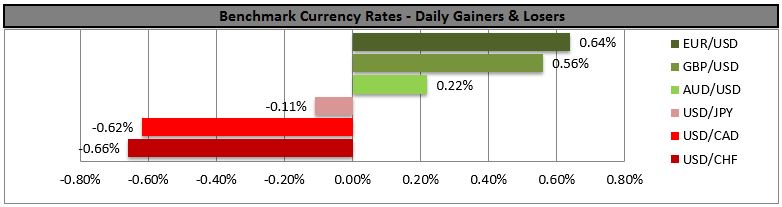
BENCHMARK CURRENCY RATES - DAILY GAINERS AND LOSERS
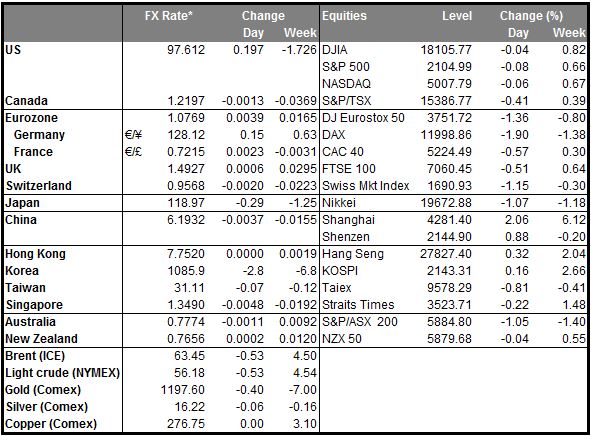
MARKETS SUMMARY