• Dollar to rally further as monetary policy diverges Those of you who trade the nonfarm payrolls should write a note about the last week in your trading notebook in red ink. The nonfarm payrolls had the biggest miss in a little over a year and yet the Fed funds futures rate expectations rose every day the following week. A week later (i.e., today) the dollar is opening higher than it was a week ago against all the G10 currencies and most of the EM currencies we track. EUR/USD reached 1.0568 in late European/early New York trading on Friday, almost taking out the recent low of 1.0458 set on March 15th, while GBP/USD did make a new low for this cycle of 1.4587 after disappointing industrial production and construction figures coupled with rising political uncertainty. The lesson is that nonfarm payrolls are important but not decisive. The FOMC has considerable discretion, so the way officials interpret the data is what matters. Friday we heard Richmond Fed President Lacker echo comments from other FOMC members that the recent weak data “may be attributable to unseasonably adverse weather.” He said that at the March FOMC meeting there was a “pretty substantial” number of people in favor of raising rates in June. The minutes said “several” people were in favor, but the Fed has never quantified how many constitute “several.” From what we hear from participants, many of them still want to start tightening at the earliest possible moment. This monetary policy divergence remains the basis of support for USD.
• Canadian statistics boost CAD temporarily CAD had a few good moments on Friday after it was reported that jobs unexpectedly rose in March, in part because of hiring in the natural resource industry – making it even more surprising. Meanwhile, housing starts were up sharply in the same month. The news adds to other recent data, such as a narrowing trade deficit in February and smaller-than-expected contraction in GDP in Q1, to ease fears expressed by the Bank of Canada that weakness in the economy might be “front-loaded” in Q1. It therefore makes it even less likely that the Bank of Canada will cut rates this week (see below).
• Incredibly disappointing Chinese exports spur stock market rally If you thought it was hard to trade the NFP, imagine trying to anticipate moves in Chinese stocks! The March trade data released today showed an unexpected collapse in exports, which fell 15.0% yoy (expected: +9.0%). The trade surplus unexpectedly fell to USD 3.1bn (expected: USD 40.1bn) as a result. The March figures are erratic and often low; for example, the country had a trade deficit in March 2013 and March 2010. Nonetheless, combined with weak exports from South Korea (down on a yoy basis each month for the first three months of the year) they suggest a weak external environment is likely to add to sluggish domestic demand and slowing investment to put pressure on the Chinese economy. Result: Shanghai stocks up 1.5%! One money manager quoted on Bloomberg explained it nicely: “The trade figures aren’t good but that’ll lead to market expectations of more stimulus.” In other words, bad news is good news. The problem is, I don’t think the government is likely to launch the kind of debt-fuelled stimulus program that the market is hoping for, and even if it tried, the marginal efficiency of additional fiscal stimulus would probably be pretty low, given how much has been done already. I expect investors to be disappointed eventually and for the market to fall back. That would have serious implications for AUD. AUD/USD fell sharply this morning after the trade figures came out. I remain bearish on AUD.
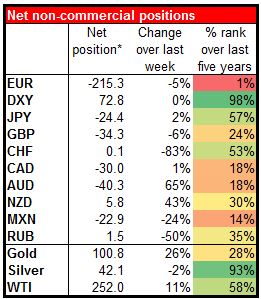
• Commitment of Traders report shows investors still bearish EUR The COT report showed that investors closed out a bit of their short EUR positions but nothing special; they remain overwhelmingly short EUR and overwhelmingly long the DXY index.
• Today’s highlights: The calendar is very light today. The only noteworthy indicator during the European day is the Swiss National Bank weekly sight deposit data, and that hasn’t been very noteworthy recently. Deposits have been steady and indeed if anything drifting lower over the past month, indicating that the SNB has not been intervening in the market.
• There are no major events or indicators released during the US session and no speakers on Monday’s agenda.
• As for the rest of the week, the big day is Wednesday when we have two central bank policy meetings: the ECB and the Bank of Canada. At their last meeting, the ECB announced the details of the QE program and the first month of its implementation has already been successful. The Bank achieved its 60bn target, as it bought around 50bn government bonds and another 10bn from its other programs. Therefore, expectations for new measures are limited. There could be some comments about Greece, in particular the size of Greek banks’ use of ELA. The Bank of Canada is expected to keep rates unchanged, so the market impact will depend on the tone of the statement. The recent good data could bring a more optimistic statement that would cause CAD to firm, especially given the speculative community’s short CAD position.
• On Tuesday, we get UK’s CPI for March. It’s expected to remain at zero, with the core rate expected to stay at 1.2%. As the inflation rate falls this pushes back expectations of a rate hike. Thus, a drop here could be negative for GBP. In the US, retail sales for March are coming out. Both figures are forecast to have rebounded after falling in February. The strong report could add to the greenback’s strength.
• On Wednesday besides the two central bank meetings we also have a number of important indicators from China: Q1 GDP, retail sales, industrial production and fixed asset investment for March. Q1 GDP is expected to slow to 7.0% yoy from 7.3%. This is the government’s target so it wouldn’t necessarily set off any alarm bells. However, a below-expectations growth rate is likely to weaken AUD and NZD.
• On Thursday, Australia’s unemployment rate for March is expected to remain unchanged at 6.3%, while employment is expected to increase by the same figure as in February. This could strengthen AUD a bit. In the US, we get housing starts and building permits for March. Even though the data are likely to show a mixed condition, a rise in housing starts and a decline in building permits, the overall trend is consistent with an improving housing market, which could boost US confidence and support USD.
• On Friday, UK employment data are due out. The unemployment rate for February expected to fall slightly, which normally could be GBP-positive, but at the same time the growth in average weekly earnings is expected to slow, so net net, it’s probably going to be a non-event or even GBP-negative. From the US and Canada, we get the CPIs for March.
• Finally, the G20 finance ministers & central bank governors meet in Washington on Thursday ahead of the spring meeting of the IMF. All the grandees of global finance will be there and are likely to make a lot of speeches. The US Treasury last week framed what’s likely to be a major debating point when it criticized several countries for excessive reliance on monetary policy and insufficient use of fiscal policy to stimulate demand. As a result Germany may come in for some criticism for its current account surplus, but the country is sure to ignore any such criticism, as it has up to now.
The Market
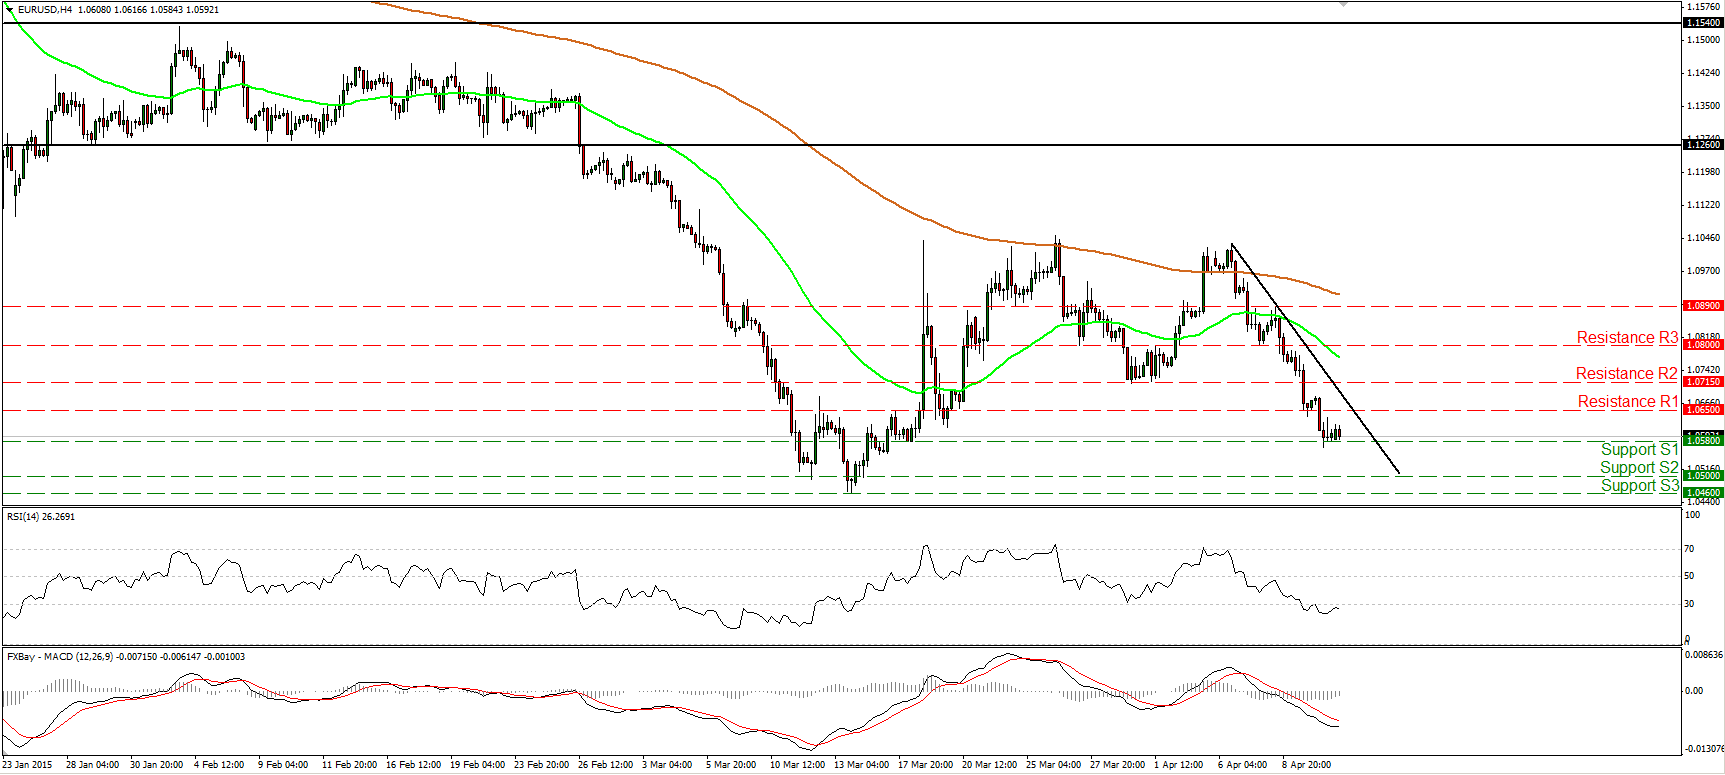
EUR/USD breaks below 1.0650
• EUR/USD tumbled on Friday, breaking below the support (now turned into resistance) barrier of 1.0650 (S1). The fall was halted at 1.0580 (S1). A decisive break of that level could set the stage for another test of the psychological zone of 1.0500 (S2). After another unsuccessful attempt to move above 1.1045, the rate started sliding and on Thursday, the move below 1.0715 (R2) signaled the completion of a double top formation. Having this in mind, I would consider the short-term bias to be negative. Our daily momentum indicators detect bearish momentum and amplify the case for further declines. The 14-day RSI hit resistance slightly above its 50 line and turned down, while the daily MACD, already negative, has topped and fallen below its signal line. In the bigger picture, EUR/USD is still trading below both the 50- and the 200-day moving averages. A clear close below 1.0460 (S3) will confirm a forthcoming lower low and trigger the resumption of the larger downtrend.
• Support: 1.0580 (S1), 1.0500 (S2), 1.0460 (S3)
• Resistance: 1.0650 (R1), 1.0715 (R2), 1.0800 (R3)
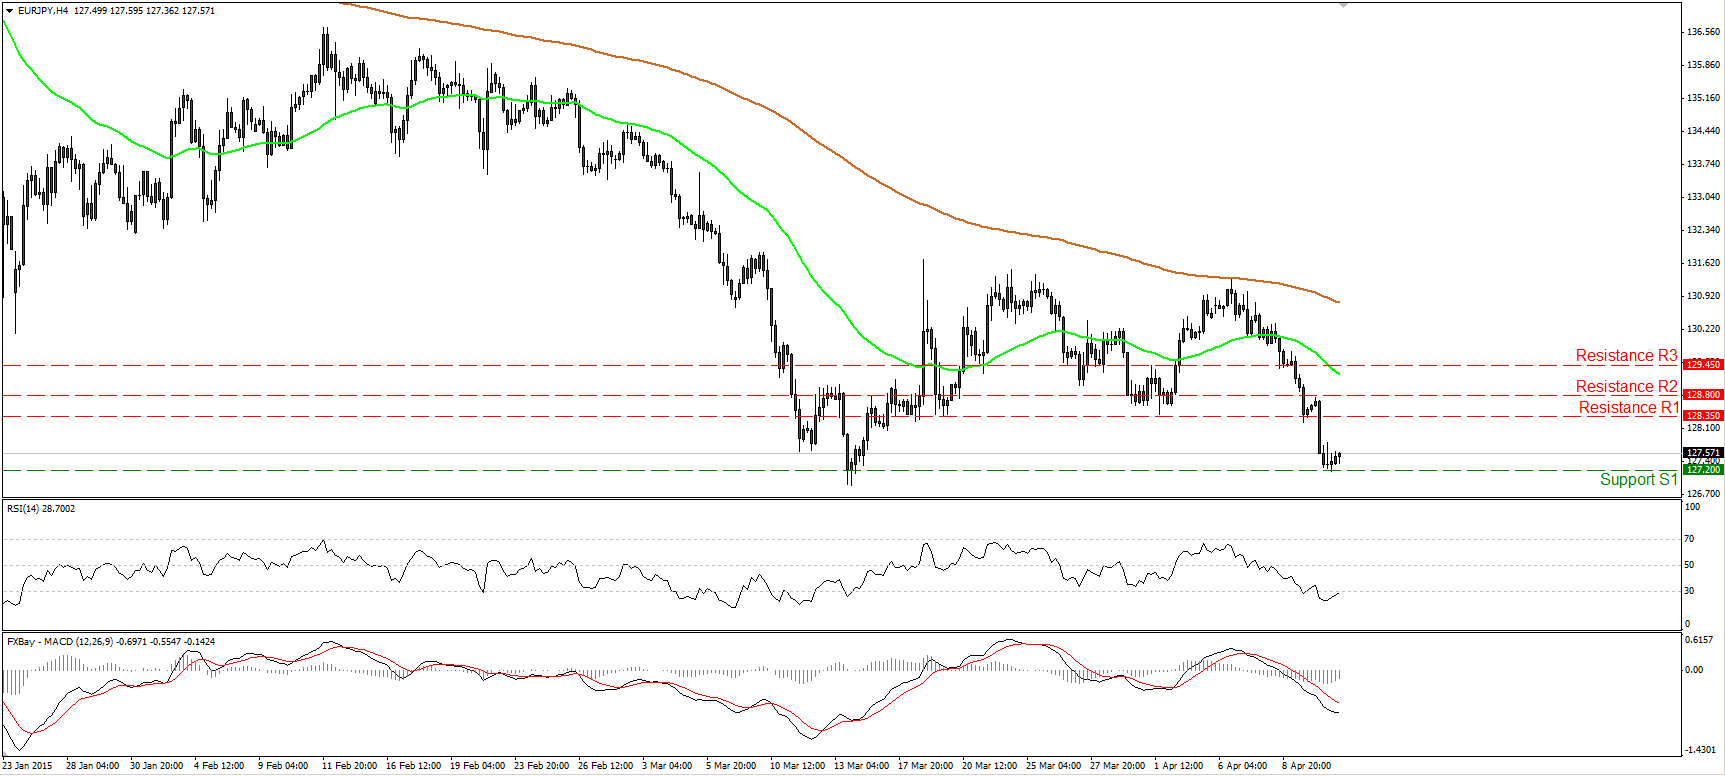
EUR/JPY tumbles below 128.00
• EUR/JPY collapsed, falling below the support (turned into resistance) of 128.35 (R1) and completing a double top formation. The short-term bias stays negative in my opinion, and I would expect a possible break below 127.20 (S1) to pave the way for the psychological territory of 125.00 (S2), marked by the low of the 13th of June 2013. Looking at our short-term oscillators however, I would be careful that a possible upside corrective move could be on the cards. The RSI appears willing to exit its oversold territory, while the MACD, although negative, shows signs of bottoming. As for the broader trend, I still see a longer-term downtrend. A decisive close below 127.20 (S1) would confirm a forthcoming lower low on the daily chart, and signal the continuation of the larger downtrend. My only concern is that there is still negative divergence between both the daily oscillators and the price action.
• Support: 127.20 (S1), 125.00 (S2), 123.85 (S3)
• Resistance: 128.35 (R1), 128.80 (R2), 129.45 (R3)
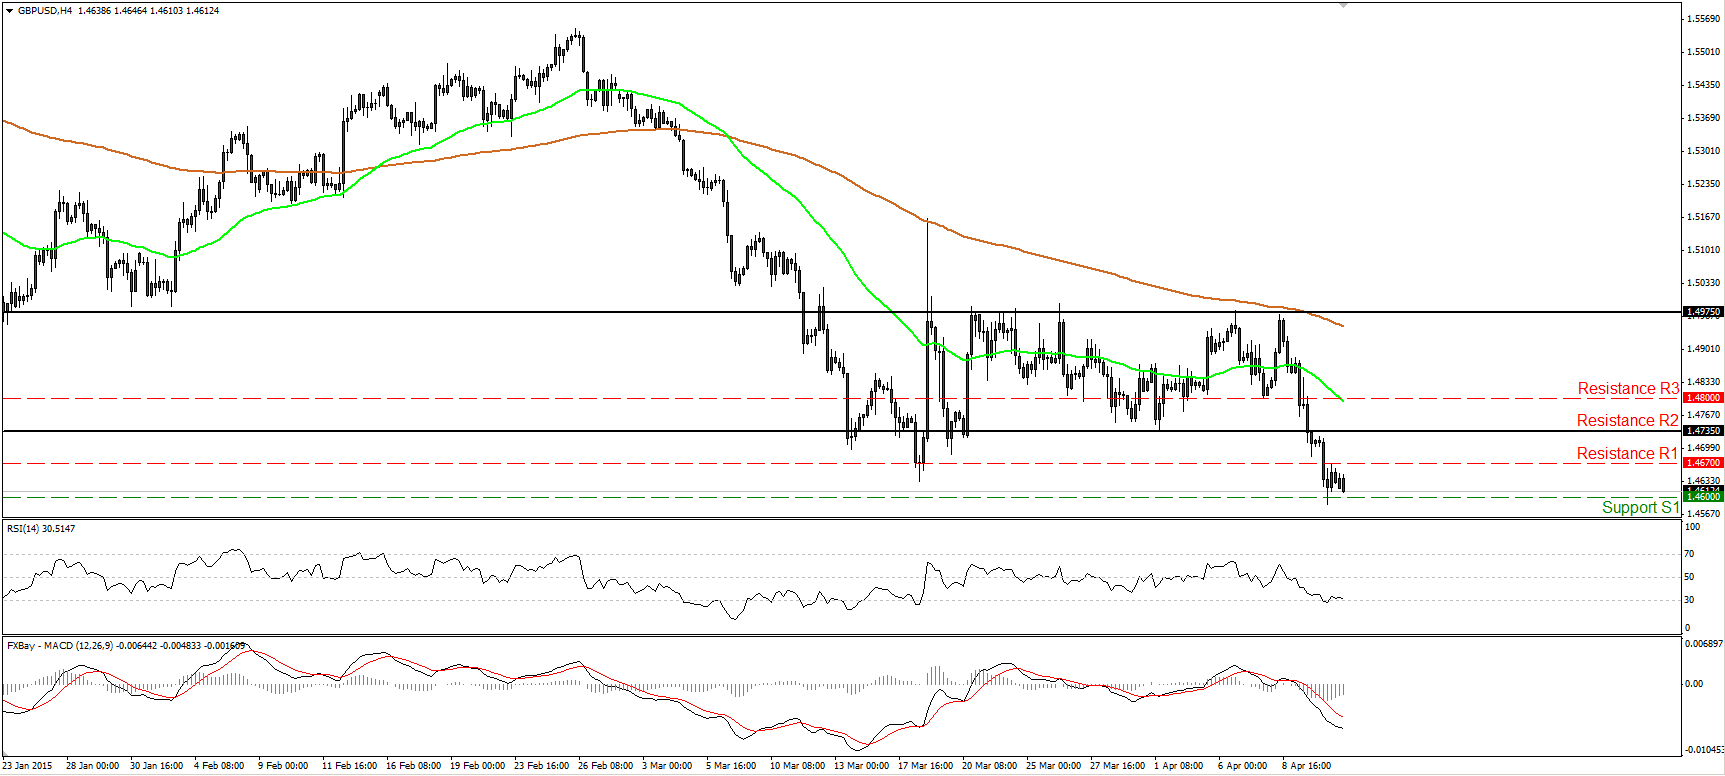
GBP/USD looks willing to break below 1.4600
• GBP/USD continued sliding on Friday and today in the early European morning, it appears ready to challenge the 1.4600 (S1) support obstacle. If the bears are strong enough to overcome that line, I would expect them to trigger extensions towards the psychological zone of 1.4500 (S2), also marked by the low of the 11th of June 2010. Zooming out to the daily chart, I see that our daily oscillators detect strong downside momentum. The RSI slid after finding resistance slightly below its 50 line, while the MACD, already negative, has topped and fallen below its trigger line. The overall trend is negative as well. The break below 1.4735 (R2) signaled the downside exit of a sideways range and triggered the resumption of the larger downtrend.
• Support: 1.4600 (S1), 1.4500 (S2), 1.4400 (S3)
• Resistance: 1.4670 (R1), 1.4735 (R2), 1.4800 (R3)
Gold hits resistance at 1210
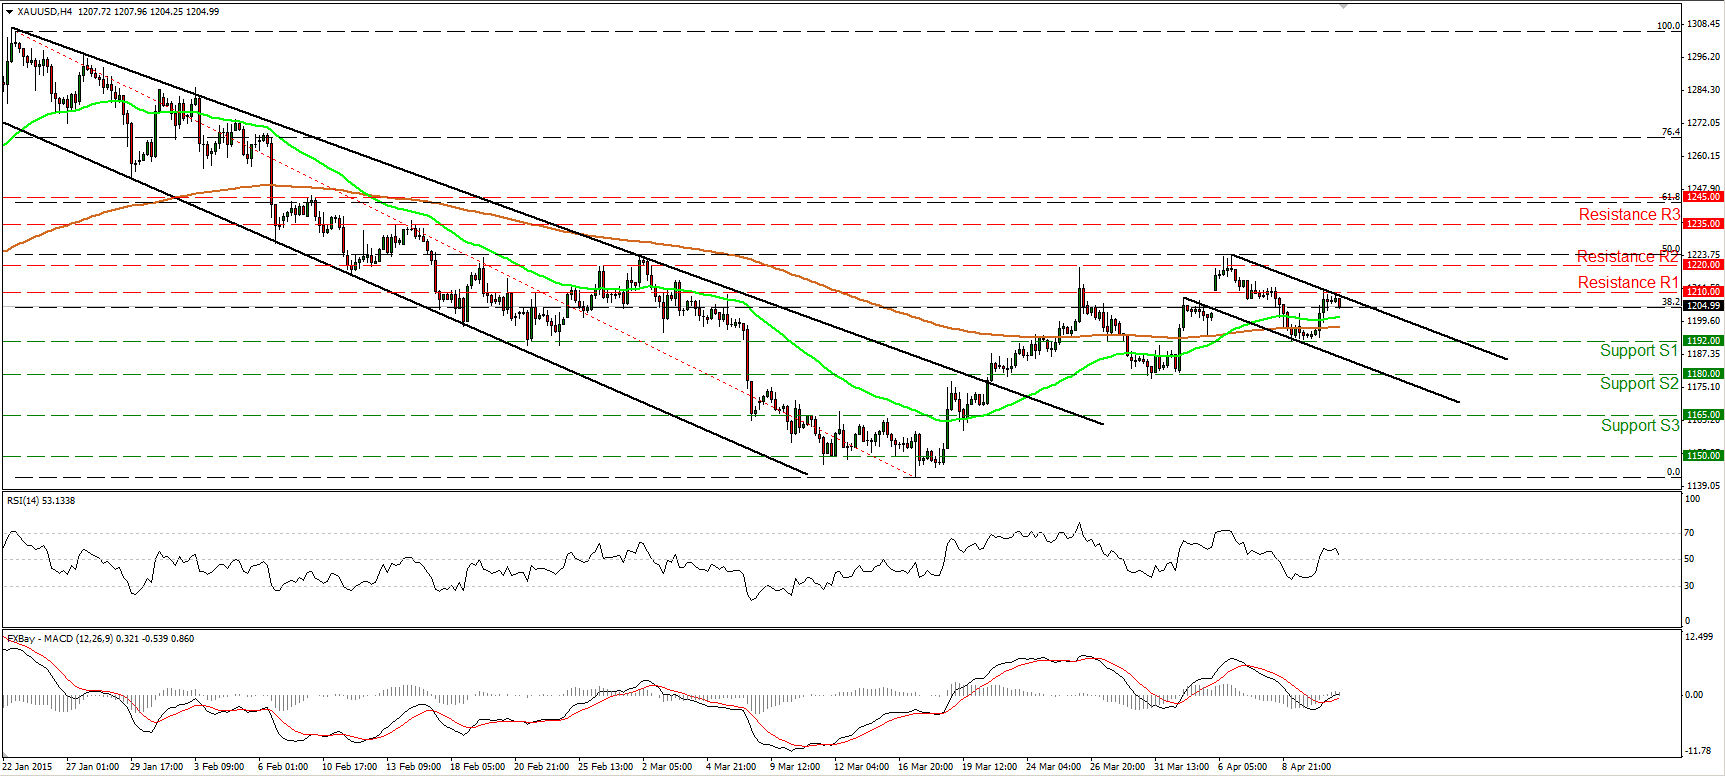
• Gold raced higher on Friday, but during the Asian morning Monday, it hit resistance at 1210 (R1) and turned down. The precious metal is trading within a possible short-term downside channel, and the possibility for a lower high around 1210 (R1) still exists. Consequently, I would expect the forthcoming wave to be negative, perhaps for a test at the support barrier of 1192 (S1). Switching to the daily chart, I see that on Monday, gold formed a shooting star candle after hitting the 50% retracement level of the 22nd of January - 17th of March decline. This makes me believe that the 17th of March – 06th of April recovery was just a corrective move and that the bias is back to the downside.
• Support: 1192 (S1), 1180 (S2), 1165 (S3)
• Resistance: 1210 (R1), 1220 (R2), 1235 (R3)
WTI breaks the upper bound of a falling wedge
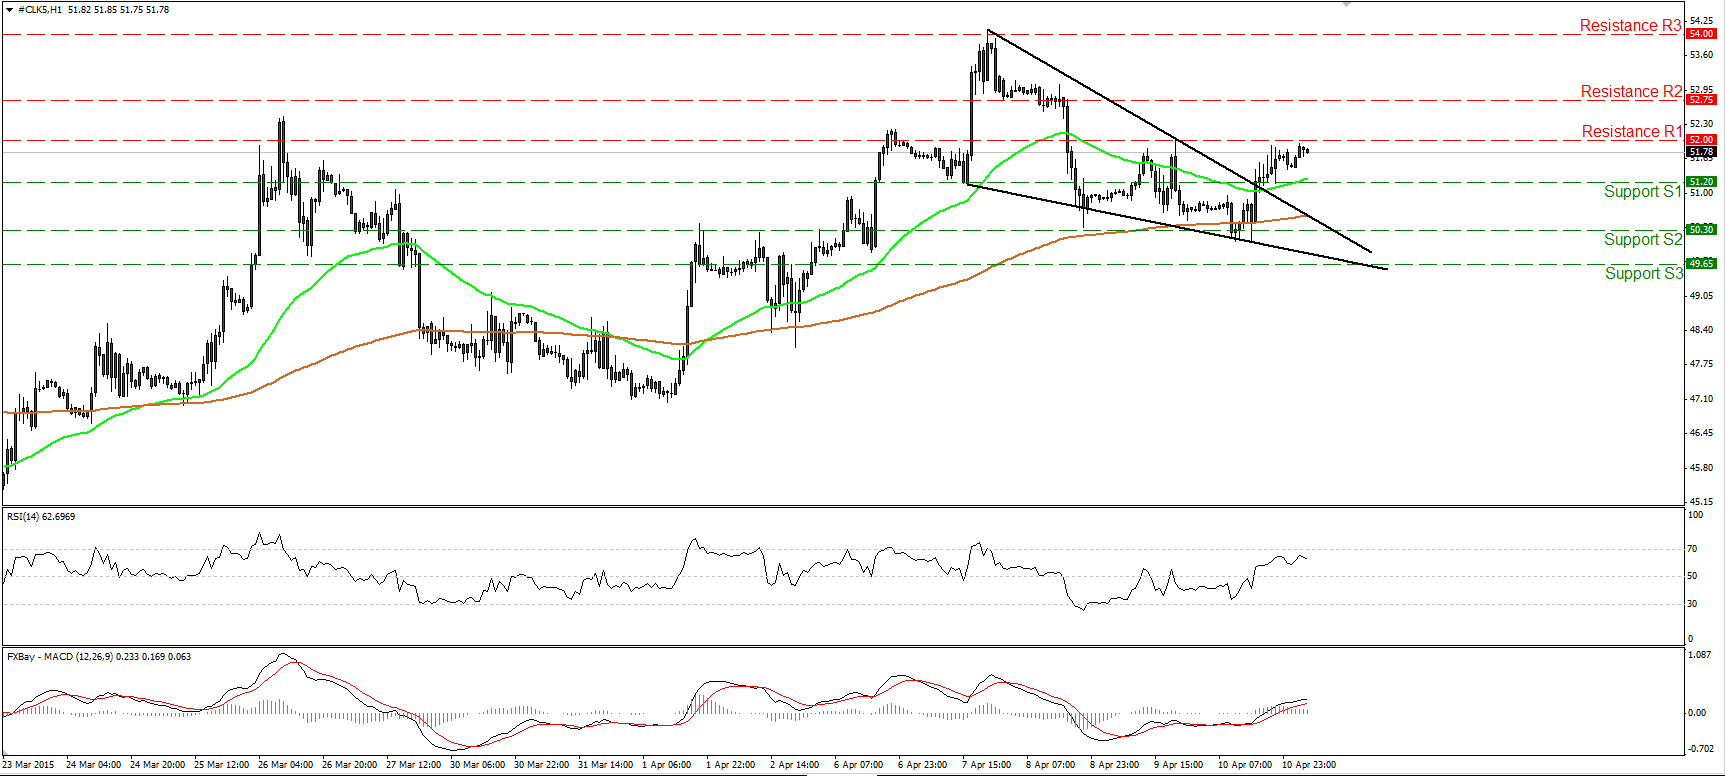
• WTI raced higher on Friday, breaking above the upper line of a falling wedge formation. During the early European morning Monday, the price seems ready to challenge the resistance hurdle of 52.00 (R1). A clear move above that obstacle is likely to trigger further bullish extensions, perhaps towards the next resistance, at 52.75 (R2). Our daily oscillators indicate bullish momentum and support the notion. The 14-day RSI stands above its 50 line and points somewhat up, while the daily MACD lies above both its trigger and zero lines. Although I would expect WTI to move higher in the short run, I would adopt a flat stance as far as the overall picture is concerned. The reason is because the price has been oscillating between 44.00 and 55.00 since the beginning of the year with no clear trending structure.
• Support: 51.20 (S1), 50.30 (S2), 49.65 (S3)
• Resistance: 52.00 (R1) 52.75 (R2), 54.00 (R3)

