China cuts rates again The People’s Bank of China surprised the markets and cut the benchmark one-year lending rate by 25 bps to 5.35% on Saturday night, as well as the one-year benchmark deposit rate by the same amount to 2.5%. The move followed the reduction in banks reserve requirement ratio in February and is the second rate cut in less than four months in an attempt to increase lending and spur growth. In just few days we have the annual meeting of China’s parliament and the interest rate reduction suggests that the 2015 growth target may be lowered to 7% from the current 7.5%. Economic data released after the rate cut, showed that the Chinese manufacturing PMI remained in contractionary territory in February, justifying the Bank’s decision to step up support for the economy. Australia and New Zealand, whose economies are heavily dependent on exports to China, saw their currencies opening with a gap up on the news but gave back all the gains and fell even more in the following hours.
Today’s highlights: In Europe, we get the manufacturing PMI figures for February from several European countries, including the UK, and the final figure for the Eurozone as a whole. As usual, the final forecasts for the French, the German and Eurozone’s figures are the same as the initial estimates. The UK manufacturing PMI is estimated to slightly increase to 53.4 from 53.0. The 1st estimate of Eurozone CPI for February is also coming out. The moderate German CPI deflation increased the likelihood that Monday’s eurozone CPI is also likely to show deflation moderating somewhat, which could support EUR. Eurozone’s unemployment rate for January is also due out.
In Switzerland, the Swiss National Bank will release its weekly sight deposits, which could reveal if the Bank intervened in the FX market in the week ended Feb. 27.
From Canada, the RBC Manufacturing PMI for February is expected. The market doesn’t pay that much attention to it and prefers the Ivey manufacturing PMI instead.
In the US, the final Markit manufacturing PMI and the ISM manufacturing index both for February are to be released. Personal income and spending for January are also due out. Personal income is expected to rise on a mom basis at a faster pace than in December, while personal spending is anticipated to fall at a slower pace. The nation’s yoy rate of the PCE deflator is expected to decelerate a bit, while the core PCE rate is forecast to remain unchanged, in line with the 2nd estimate of Q4 core PCE in Friday’s GDP figures.
As for the rest of the week, while Friday’s US employment report will be the focus as usual, there are a several central banks meetings preceding it. On Thursday, the main event will be the ECB policy meeting. The focus will probably be on further details about the QE program and the exact date that it will be launched in March. Another important detail to be clarified is if the Bank will buy bonds that are trading in negative territory when it comes to yields.
On Tuesday, the main event will be the Reserve Bank of Australia monetary policy decision. The market consensus is for another 25 bps rate cut to 2% at its March meeting, the same margin as in February. The further rate cut can be supported by the disappointing Q4 private capital expenditure, even though the first rate cut occurred ahead of this indicator.
On Wednesday, the highlight will be the Bank of Canada policy meeting. In their last rate decision, the Bank surprised the market with a 25 bps cut in rates, the first change since it hiked rates to 1% in Sep. 2010. The market was expecting another 25 bps rate cut to 0.5%. However the comments by BoC Governor Poloz on Wednesday that last month’s rate cut has bought the central bank some time to see how the economy develops, has reduced the odds of a change to only 30%. We too believe that they will most likely remain on hold this time. The final service-sector PMIs for the countries we got the manufacturing figures on Monday are coming out. In the US, we have the ADP employment report as usual two days ahead of the NFP release. The ADP report is expected to show that the number of jobs gained in February increased from January.
On Thursday, besides the ECB meeting, the Bank of England meets to decide on its policy rate. There’s little chance of a change in rates, hence, the impact on the market should be minimal, as usual. The minutes of the meeting however, should make interesting reading when they are released on 18th of March.
Finally on Friday, the major event will be the US non-farm payrolls for February. The market consensus is for an increase in payrolls of 240k, down from 257k in January. At the same time the unemployment rate is forecast to decline to 5.6%, while average hourly earnings are expected to rise at the same pace as in January. Such figures would be consistent with the FOMC’s view about the strong employment market.
The Market
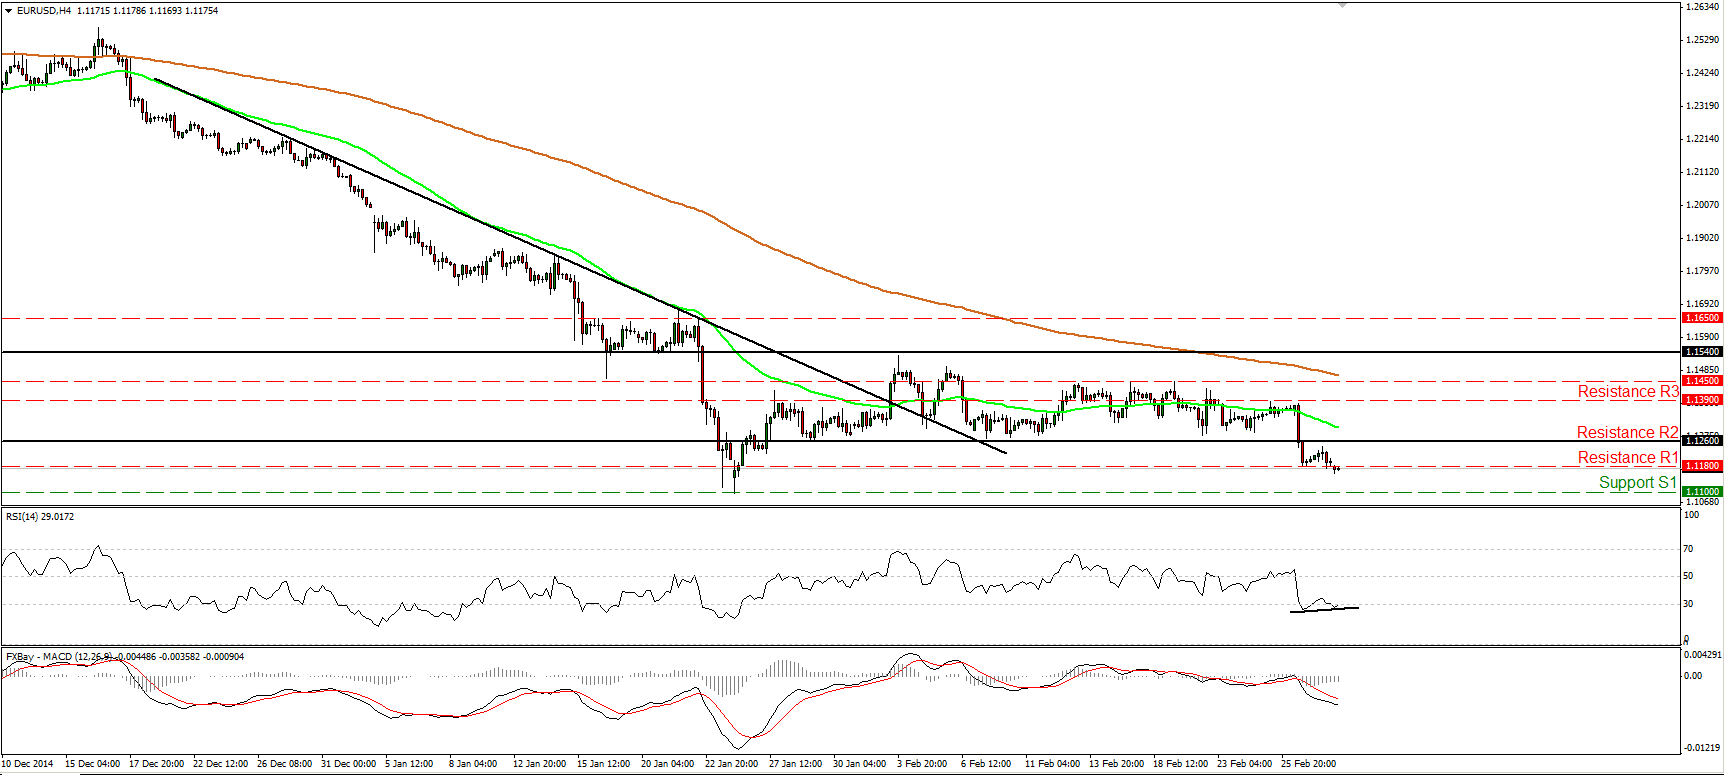
EUR/USD dips below 1.1180
EUR/USD hit resistance marginally below the 1.1260 (R2) barrier and slid to trade below the support (now turned into resistance) line of 1.1180 (R1). I still believe that we are likely to see sellers challenging the support area of 1.1100 (S1), defined by the low of the 26th of January. Nevertheless, in today’s economic agenda we get Eurozone’s preliminary CPI rate for February. After the slowdown in Germany’s deflation, there is the possibility that deflation will moderate in the euro-area as well. This could cause a minor bounce before the bears take the reins again. The RSI gives me an extra reason to be careful about such a bounce. There is positive divergence between the oscillator and the price action. The oscillator also appears able to exit its oversold territory in the close future. With regards to the broader trend I believe that the pair is still in a downtrend. EUR/USD is printing lower peaks and lower troughs below both the 50- and the 200-day moving averages. A break below the 1.1100 (S1) line in the future could challenge our next support at 1.1025 (S2), defined by the high of the 1st of September 2003.
• Support: 1.1100 (S1), 1.1025 (S2), 1.1000 (S3).
• Resistance: 1.1180 (R1), 1.1260 (R2), 1.1390 (R3).
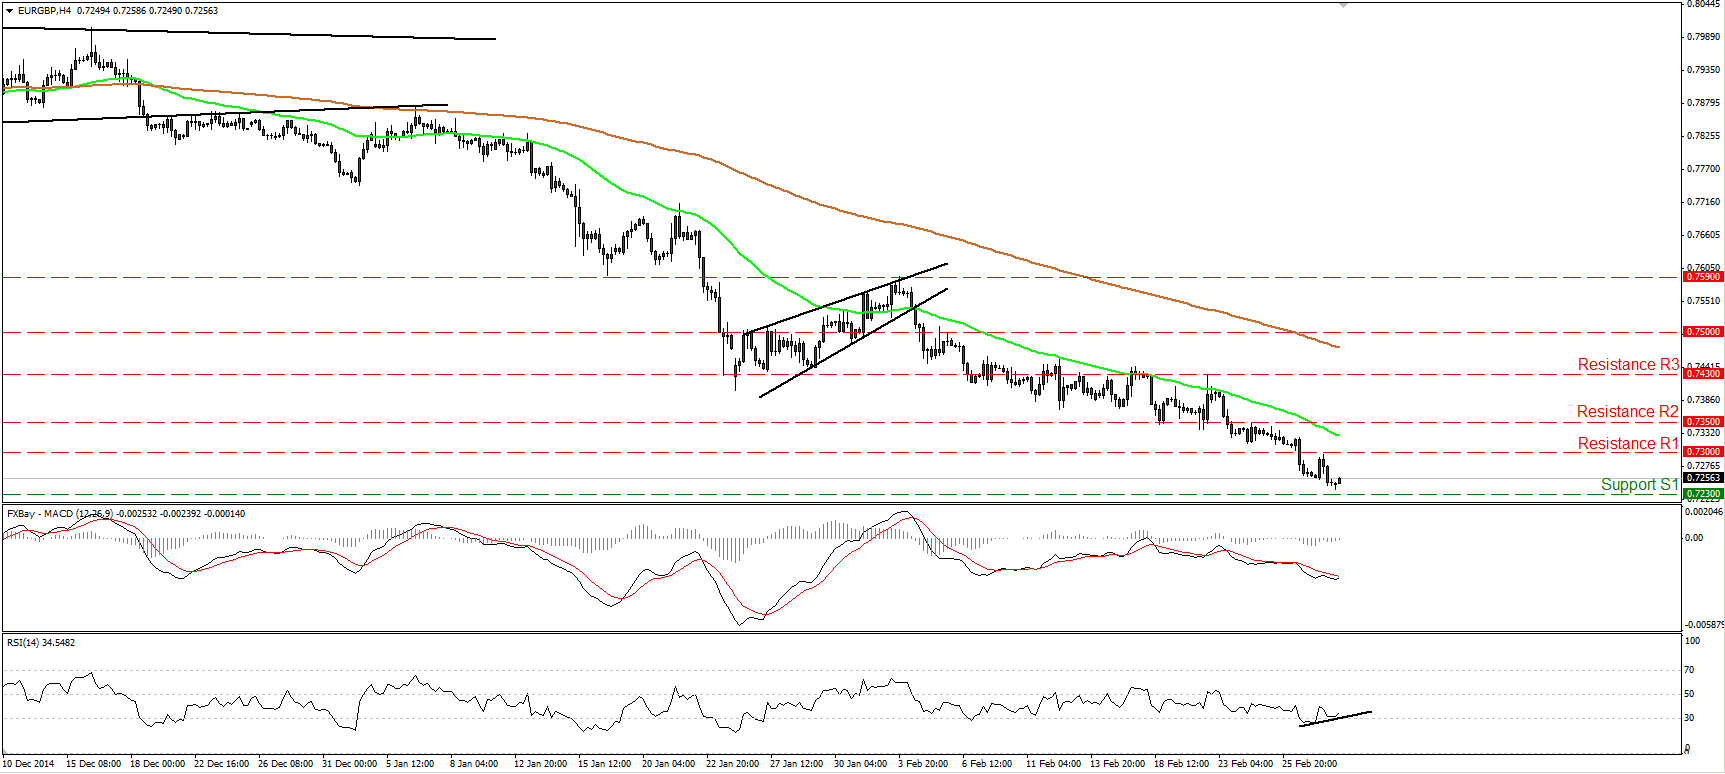
EUR/GBP hits support slightly above 0.7230
EUR/GBP traded somewhat lower and found support marginally above the 0.7230 (S1) line, defined by the high of the 7th of December 2007. On the 4-hour chart, the price structure still suggest a short-term downtrend, thus I would expect a clear break below the 0.7230 (S1) barrier to set the stage for extensions towards the 0.7100 (S2) territory, marked by the lows of the 3rd and 4th of December 2007. In today’s economic agenda, we have the UK manufacturing PMI for February, which is forecast to have improved. This could be the trigger for the aforementioned break. In the bigger picture, the downside exit of the triangle pattern on the 18th of December signaled the continuation of the longer-term downtrend. Since then, the price structure has been lower peaks and lower troughs below both the 50- and the 200-day moving averages, thus I maintain my bearish view.
• Support: 0.7230 (S1), 0.7100 (S2), 0.7025 (S3).
• Resistance: 0.7300 (R1), 0.7350 (R2), 0.7430 (R3).
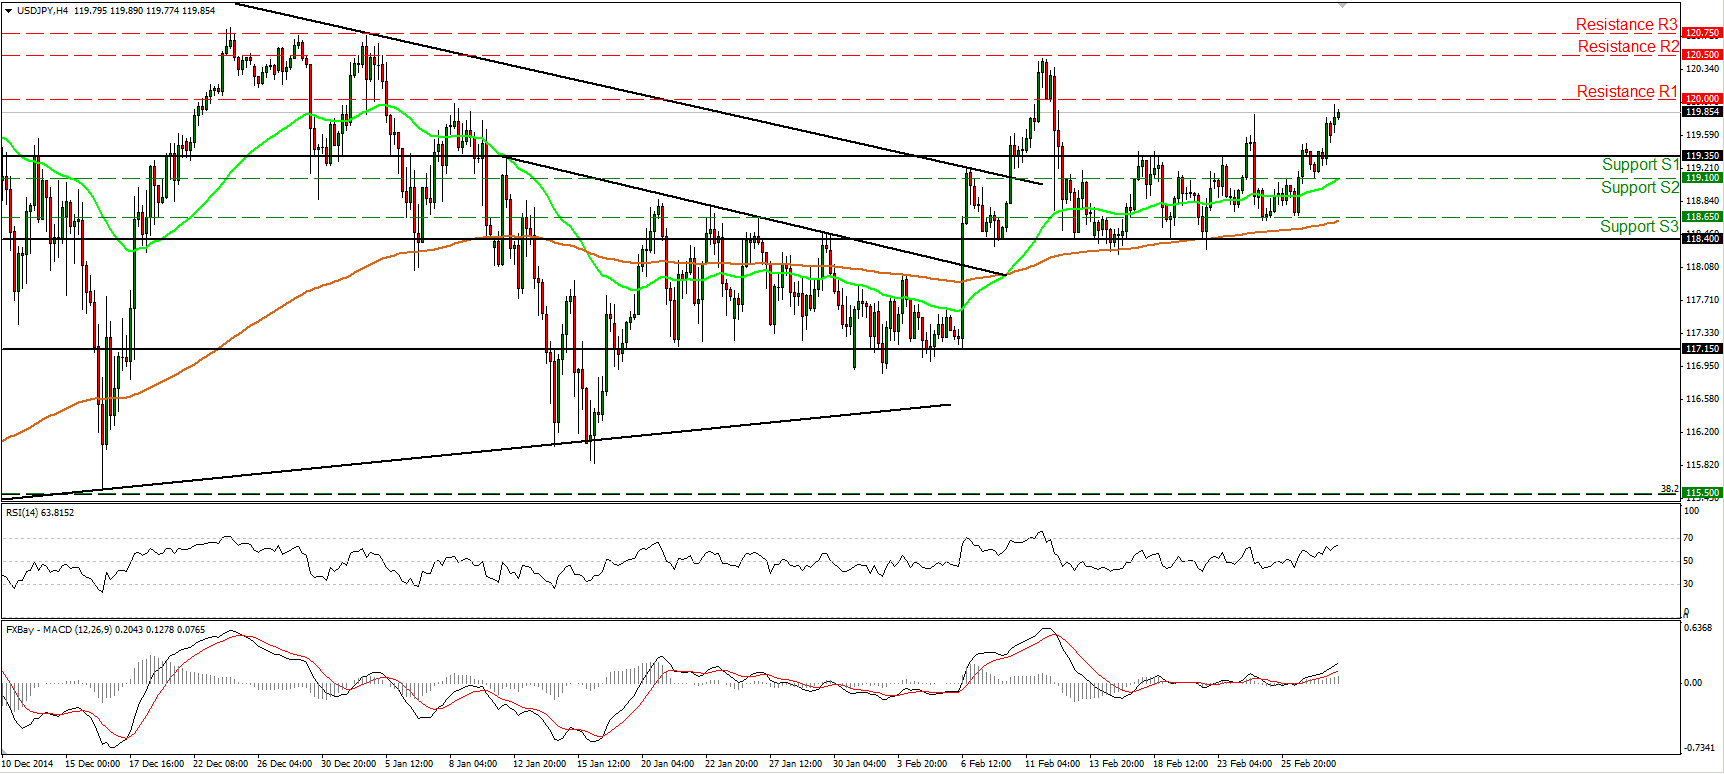
USD/JPY ready to challenge the 120.00 round figure
USD/JPY firmed up on Friday, after hitting support near 119.10 (S2). The rate surged above the key resistance zone (turned into support) of 119.35 (S1), and now appears willing to challenge the round number of 120.00 (R1). The move above 119.35 (S1) turned the near-term picture positive in my view, something that is also reflected on our momentum studies. The RSI, already above 50, raced higher, while the MACD stands above both its zero and signal lines, pointing north. A clear and decisive break above the 120.00 (R1) is likely to set the stage for extensions towards the 120.50 (R2) zone, determined by the high of the 11th of February. On the daily chart the rate is still trading above both the 50- and the 200-day moving averages and above the upper line of the triangle pattern that had been containing the price action since November. This keeps the major upside path intact, but I would like to see a break above the resistance of 120.75 (R3) to be convinced that the longer-term uptrend is back in force.
• Support: 119.35 (S1), 119.10 (S2), 118.65 (S3).
• Resistance: 120.00 (R1), 120.50 (R2), 120.75 (R3).
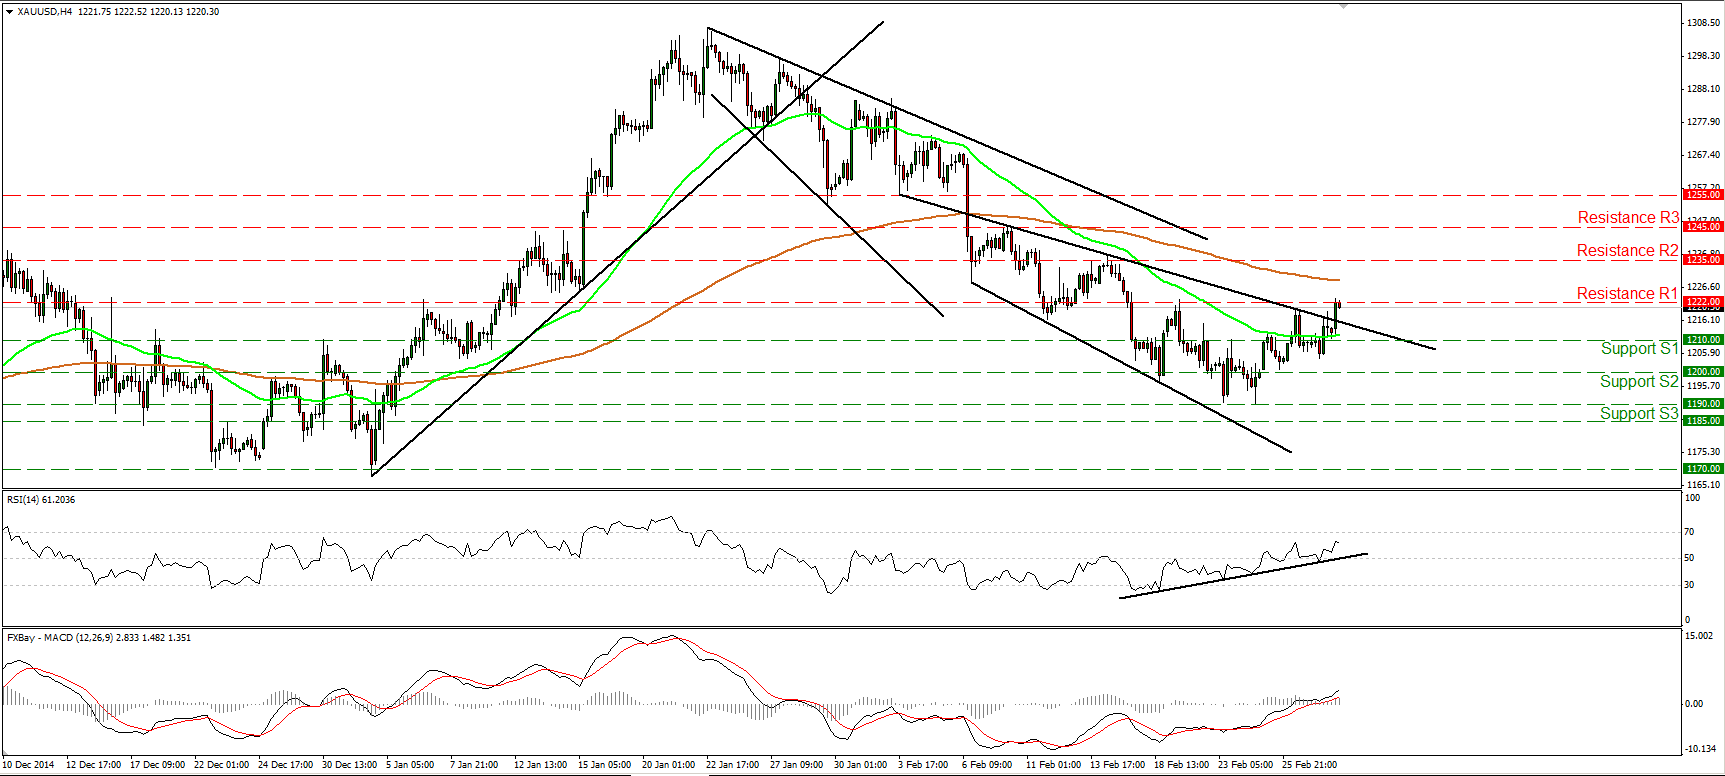
Gold breaks above a near-term downtrend line
Gold raced higher on Friday, breaking above the short-term downtrend line taken from the peak of the 10th of February. During the early European morning Monday, the metal is testing the 1222 (R1) obstacle, where an upside violation could pull the trigger for the next resistance area of 1235 (R2). The break above the aforementioned trend line shifts the intraday bias to the upside, something that is also supported by our near-term momentum studies. The RSI rebounded from near its 50 line and edged higher, while the MACD stands above both its zero and trigger lines pointing north. On the daily chart, the possibility for a lower high still exists, therefore, the near-term recovery could be a corrective move of the 22nd of January – 24th of February decline.
• Support: 1210 (S1), 1200 (S2), 1190 (S3).
• Resistance: 1222 (R1), 1235 (R2), 1245 (R3).
WTI trades in a consolidative manner
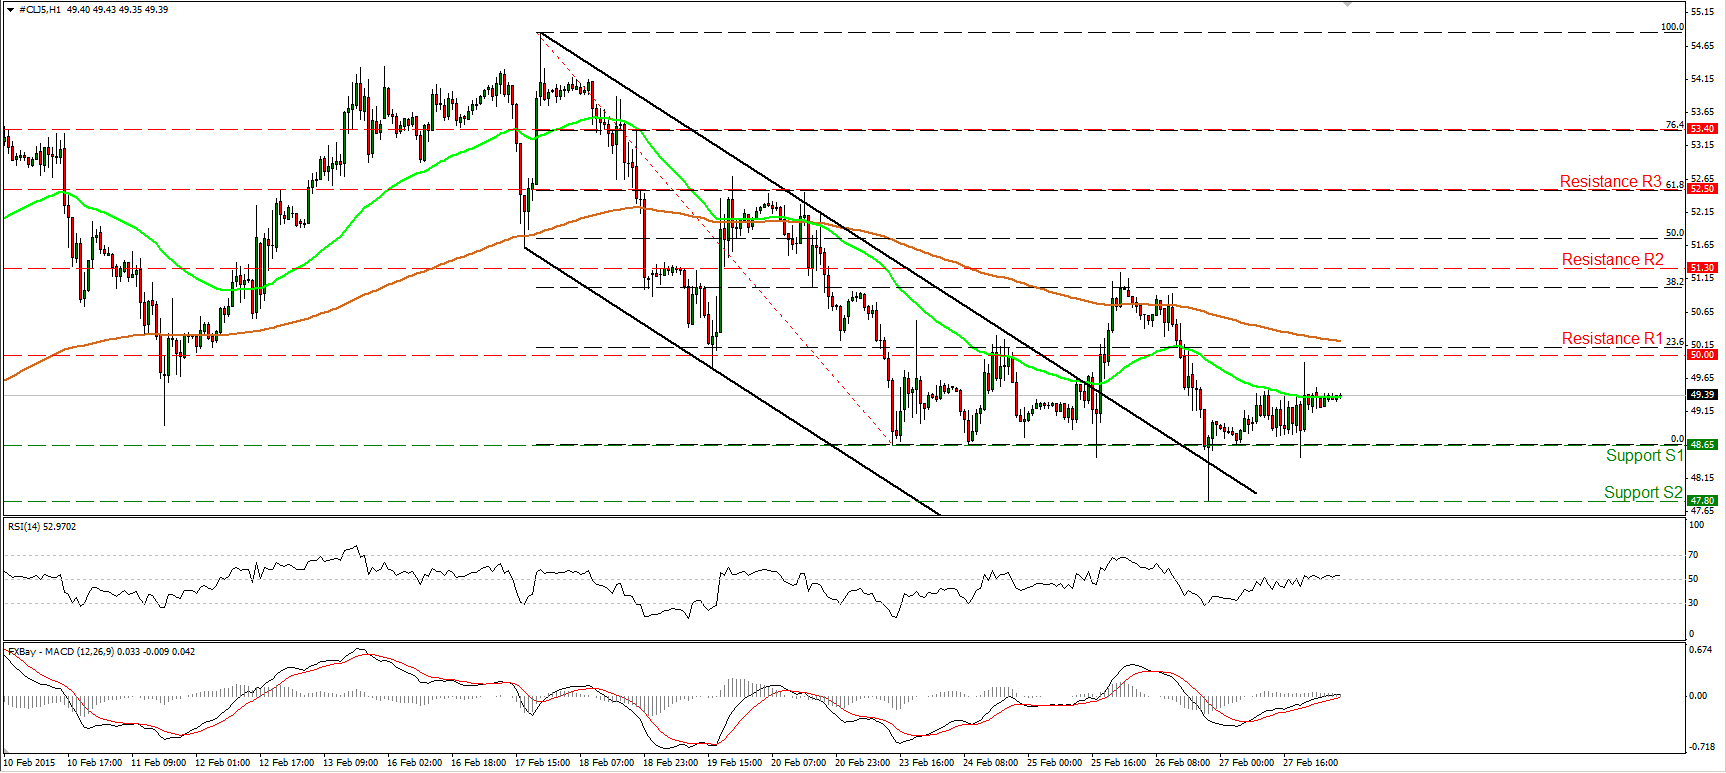
WTI moved in a consolidative mode on Friday, staying between the support of 48.65 (S1) and the resistance of 50.00 (R1). Friday’s sideways manner is also confirmed by our momentum studies. The 14-hour RSI lies near its 50 line and points sideways, while the hourly MACD stands near its zero line, pointing east as well. Taking these technical signs into account, I would adopt a “wait and see” stance as far as the short-term picture is concerned. On the daily chart, WTI is still trading below both the 50- and the 200-day moving averages, keeping the longer-term downtrend intact. I would treat any possible near-term upside extensions as a corrective move before the bears pull the trigger again.
• Support: 48.65 (S1), 47.80 (S2), 46.65 (S3).
• Resistance: 50.00 (R1) 51.30 (R2), 52.50 (R3) .

