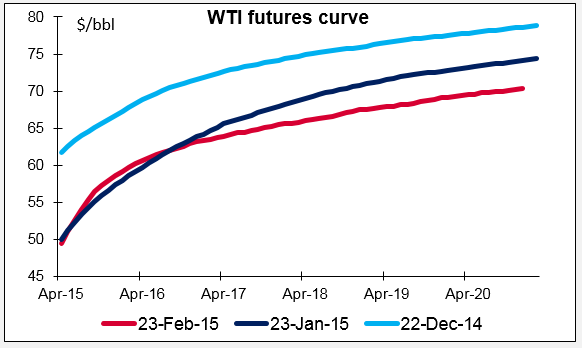
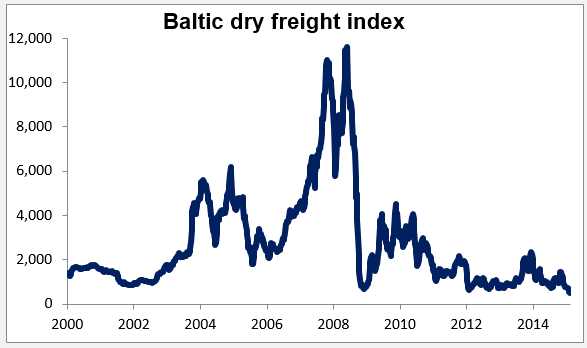
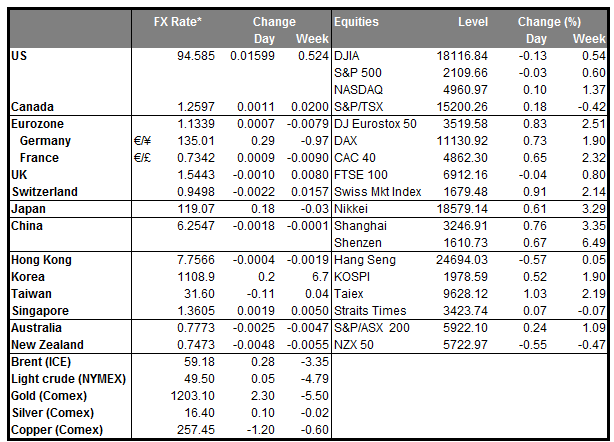
• Commodity prices continue to decline Commodity prices continued their recent decline yesterday. Most of the metals were lower, with copper off 1.2%, and both Brent and WTI were down more than 2%. Looking at the forward curve for WTI, it’s noticeable that when prices first started dropping, they were falling much more in the short end than in the long end. That’s because market participants reasoned that the cause of the decline was an oversupply of oil, and as prices fell, exploration would dry up – particularly for shale oil in the US – and supply in future years would be restricted, supporting prices further out. But recently, prices have been falling further at the long end than at the short end, meaning that market participants are starting to think that it’s a demand problem, not a supply problem. Another indication of this possibility: the Baltic dry freight index, an index of the cost of renting ships to transport commodities, has fallen to a record low. True this is partly because of an oversupply of ships, but it’s also indisputable that it’s because of reduced demand for shipping as well. Expectations that demand for commodities is likely to remain subdued for some time could depress the commodity currencies – AUD, NZD and CAD – particularly CAD, which has the largest energy component of the three.
• New Zealand inflation expectations fall New Zealand 2-year inflation expectation for Q1 fell to 1.8% from 2.06%. Investors were no doubt influenced by the decline in Q4 CPI to 0.8% yoy, below the 1% lower boundary of the RBNZ’s target range. NZD fell as the decline in inflation expectations could prompt RBNZ to cut rates at a future meeting.
• Today’s highlights: The day of the central bankers Several central bankers give important speeches or testimonies today. The spotlight will be on Fed Chair Janet Yellen’s twice-a-year report on monetary policy to Congress. The focus will likely be on any hint about when the Fed will start to normalize policy. In the minutes of the January FOMC meeting, some members saw less urgency to raise rates or even start the normalization process than the market expected. However, that meeting occurred nearly a month ago, before the release of the strong January employment report that fueled again rate hike expectations. Since then, several FOMC members have made comments that suggest they are more hawkish than the minutes would suggest. For example, yesterday Richmond Fed President Jeffrey Lacker said that the Fed could raise rates in April or June even if it doesn’t first remove the “patient” phrase from its policy statement in March. And the Nikkei published an interview with San Francisco Fed President John Williams in which he hinted at a change in the Fed’s language at its March meeting and declined to rule out a rate hike in June.
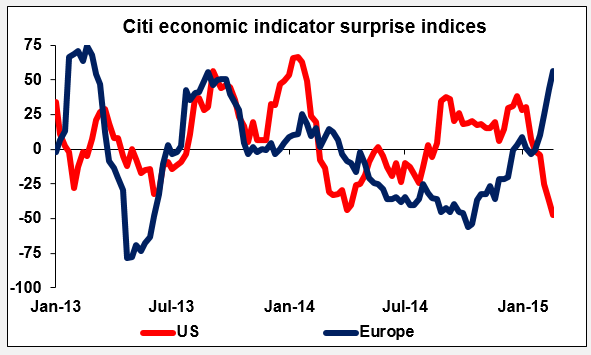
• On the other hand, aside from the employment figures, much of the US data has missed expectations recently, such as yesterday’s existing home sales for January, which fell to their lowest level in nine months, or Dallas Fed manufacturing index, which collapsed. The data sent Fed funds rate expectations lower, with the Jan. 2018 futures implied rate falling by 6 bps despite the comments by officials. Nonetheless, the market still expects the Fed to begin normalizing policy between June and September.
• Market expectations are for a fairly balanced speech from Yellen without any major change in tone. Listening to what other FOMC officials have said, I think she could choose to downgrade the importance of the word “patient” as a warning to the markets that the language may be changed in the March statement. That would probably be USD-supportive.
• In the UK, Bank of England Governor Mark Carney and other MPC members testify to the House of Commons Treasury Committee. If they maintain their tightening bias as seen in the Bank’s quarterly inflation report, this could be GBP-positive. Last time Carney spoke, he said “the most likely next move in monetary policy is an increase in interest rates.”
• And later in the day, Bank of Canada Governor Stephen Poloz speaks, followed by a press conference. His comments will be closely watched as they come just two weeks ahead of the Bank’s March meeting. His comments a month ago were quite bearish; he said that “the drop in oil prices is unambiguously negative for the Canadian economy.” He noted that their forecasts were based on the assumption that oil would average USD 60/bbl and that “the Bank has room to maneuver should its forecast prove to be either too pessimistic or too optimistic.” The market will want to hear whether the Bank’s expectations for oil have changed and if so, what that implies for monetary policy.
• Not to be left out, ECB President Mario Draghi speaks in Frankfurt at the official unveiling of the new 20-euro bank note. He gets his turn for a major speech tomorrow, when he testifies to the European Parliament.
• Greek list to be examined: Greece last night submitted the draft of a package of new economic measures to its creditors. The Eurogroup of finance ministers will discuss them on a conference call today to see if they are satisfactory. If they are, then the package will be put to national parliaments for formal approval. The package must also be approved by Greece, which could be difficult.
• Today’s indicators: In Germany, the final Q4 GDP data are expected to confirm the preliminary growth figure. The forecast is for the German economy to have grown 0.7% qoq in Q4, adding to the recent encouraging data. In Eurozone, the final CPI for January is expected to confirm the preliminary reading.
• In the US, we get S & P /Case-Shiller house price index for December, which is expected to have decelerated from November. The Richmond Fed manufacturing index, the Conference Board consumer index and the preliminary Markit service-sector PMI all for February are also to be released. These are likely to keep confidence up and the USD supported.
The Market
EUR/USD slightly lower ahead of Yellen’s testimony
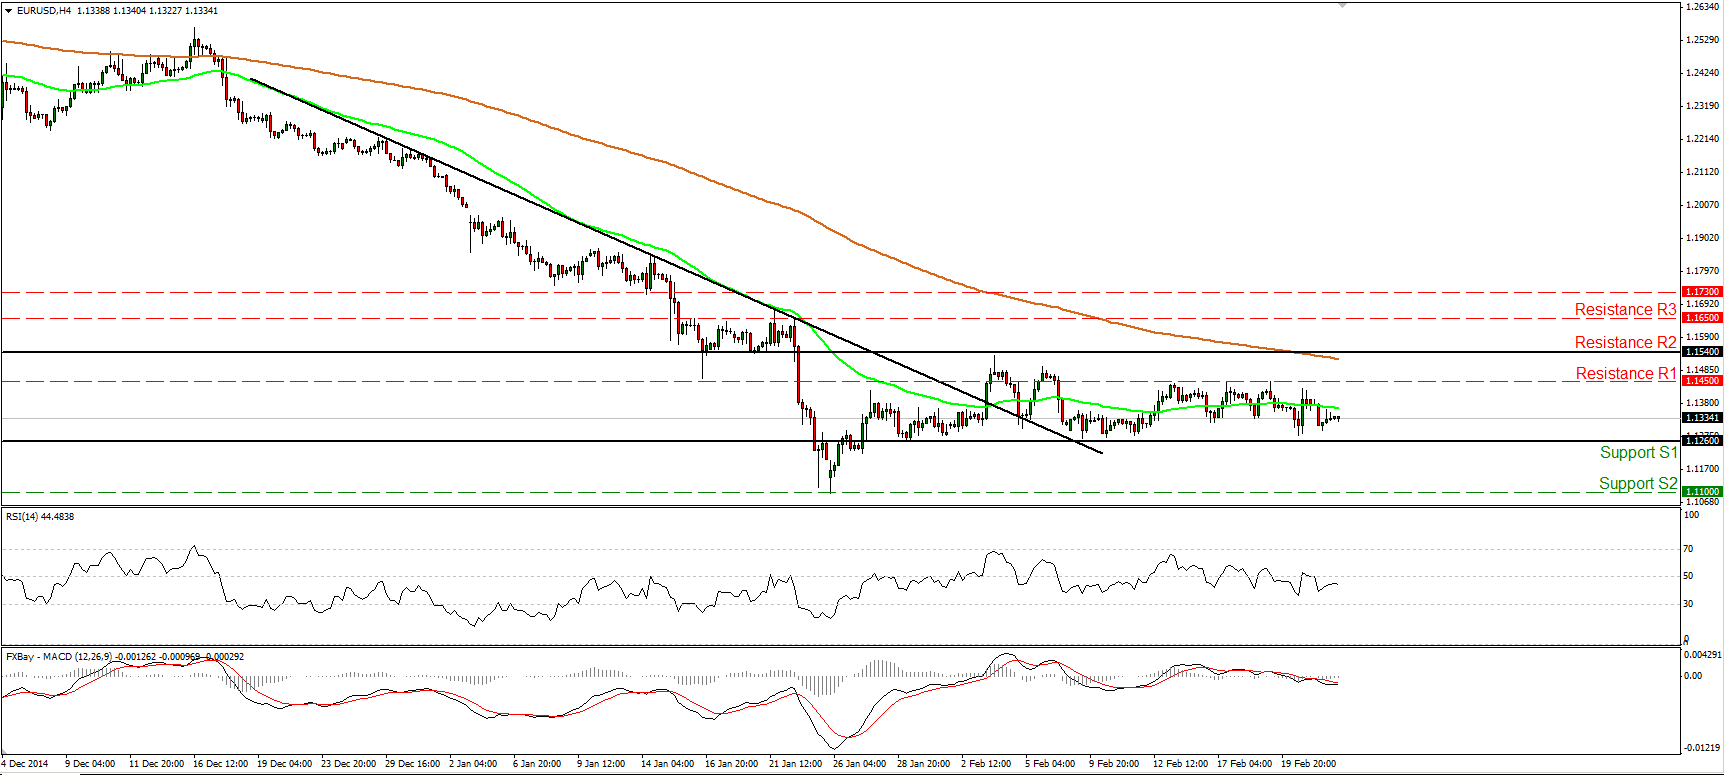
• EUR/USD slid on Monday, but the decline was halted above the key support hurdle of 1.1260 (S1). The pair continues to oscillate between that support and the resistance of 1.1540 (R2), thus I would maintain my “wait and see” approach as far as the short-term horizon is concerned. Today, Fed Chair Janet Yellen testifies to the Senate. After the strong US employment report for January, it is likely that she will sound a bit more hawkish than the minutes of the latest FOMC meeting did. If so, the pair could eventually dip below the important barrier of 1.1260 (S1). Such a break could probably open the way for another test at 1.1100 (S2), defined by the low of the 26th of January. With regards to the broader trend I believe that the pair is still in a downtrend. EUR/USD is printing lower peaks and lower troughs below both the 50- and the 200-day moving averages. In March, the ECB starts is QE program, which, I believe, will keep the pair under selling pressure and the current downtrend in force.
• Support: 1.1260 (S1), 1.1100 (S2), 1.1025 (S3)
• Resistance: 1.1450 (R1), 1.1540 (R2), 1.1650 (R3)
AUD/USD ready to challenge the 0.7750 area
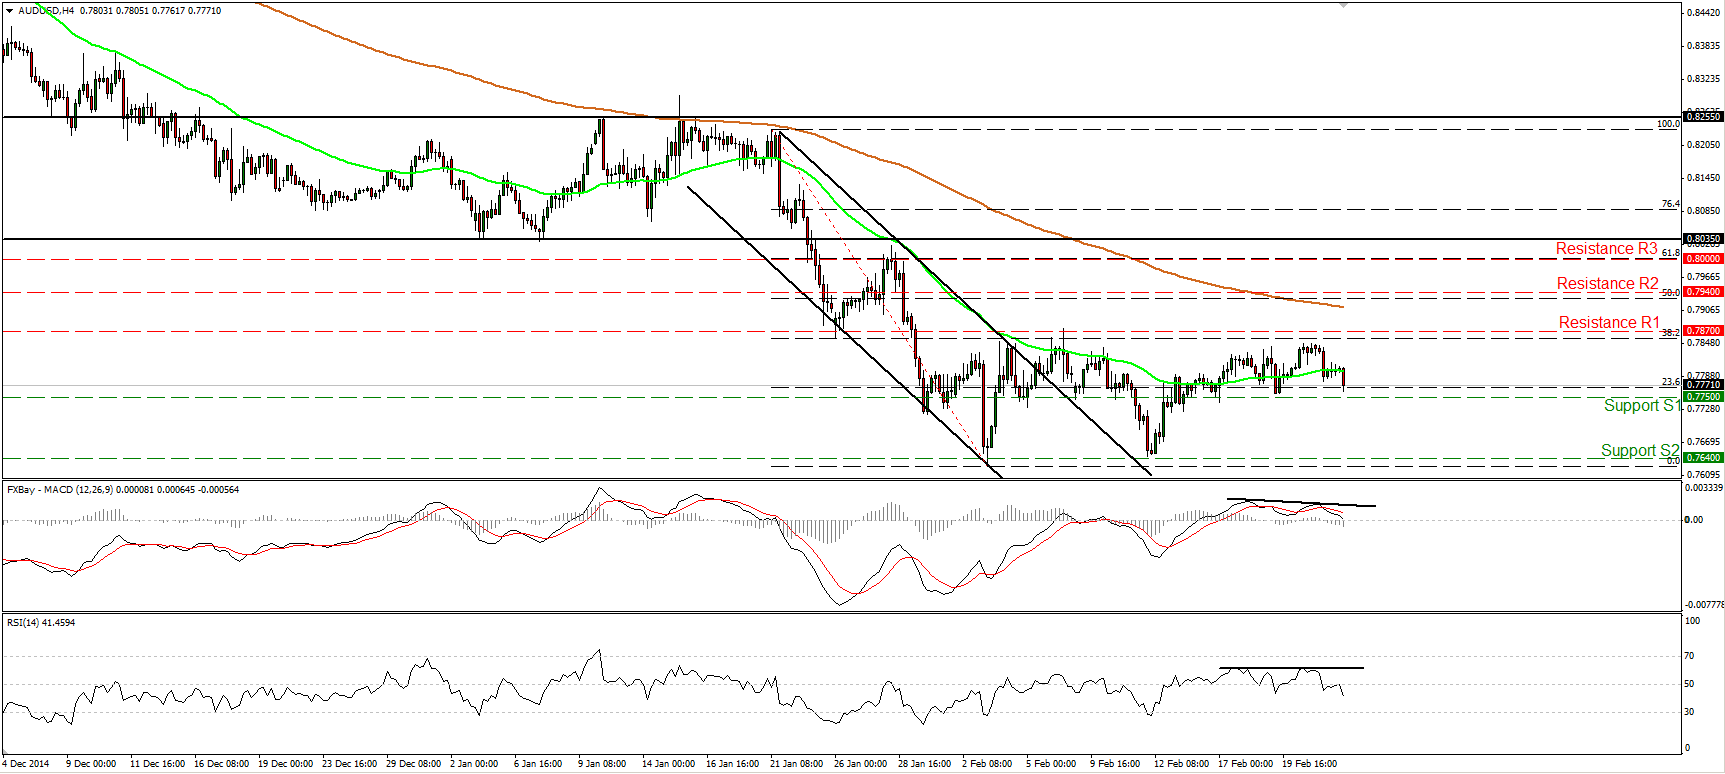
• AUD/USD slid after hitting resistance fractionally below the 38.2% retracement level of the 21st of January – 3rd of February decline. During the early European morning Tuesday, the rate is heading towards the support barrier of 0.7750 (S1), where a clear and decisive break would confirm the negative divergence seen between our oscillators and the rate, and perhaps set the stage for another test at the 0.7640 (S2) area, determined by the lows of the 3rd and 12th of February. On the daily chart, the break below the psychological round number of 0.8000 (R3) back on the 21st of January, signalled the continuation of the longer-term downtrend. Therefore I would treat the recent recovery from 0.7640 (S2) as a corrective move. I still believe that we are going to see AUD/USD challenging the 0.7500 (S3) territory in the future.
• Support: 0.7750 (S1), 0.7640 (S2), 0.7500 (S3)
• Resistance: 0.7870 (R1), 0.7940 (R2), 0.8000 (R3)
USD/CAD escapes from a triangle
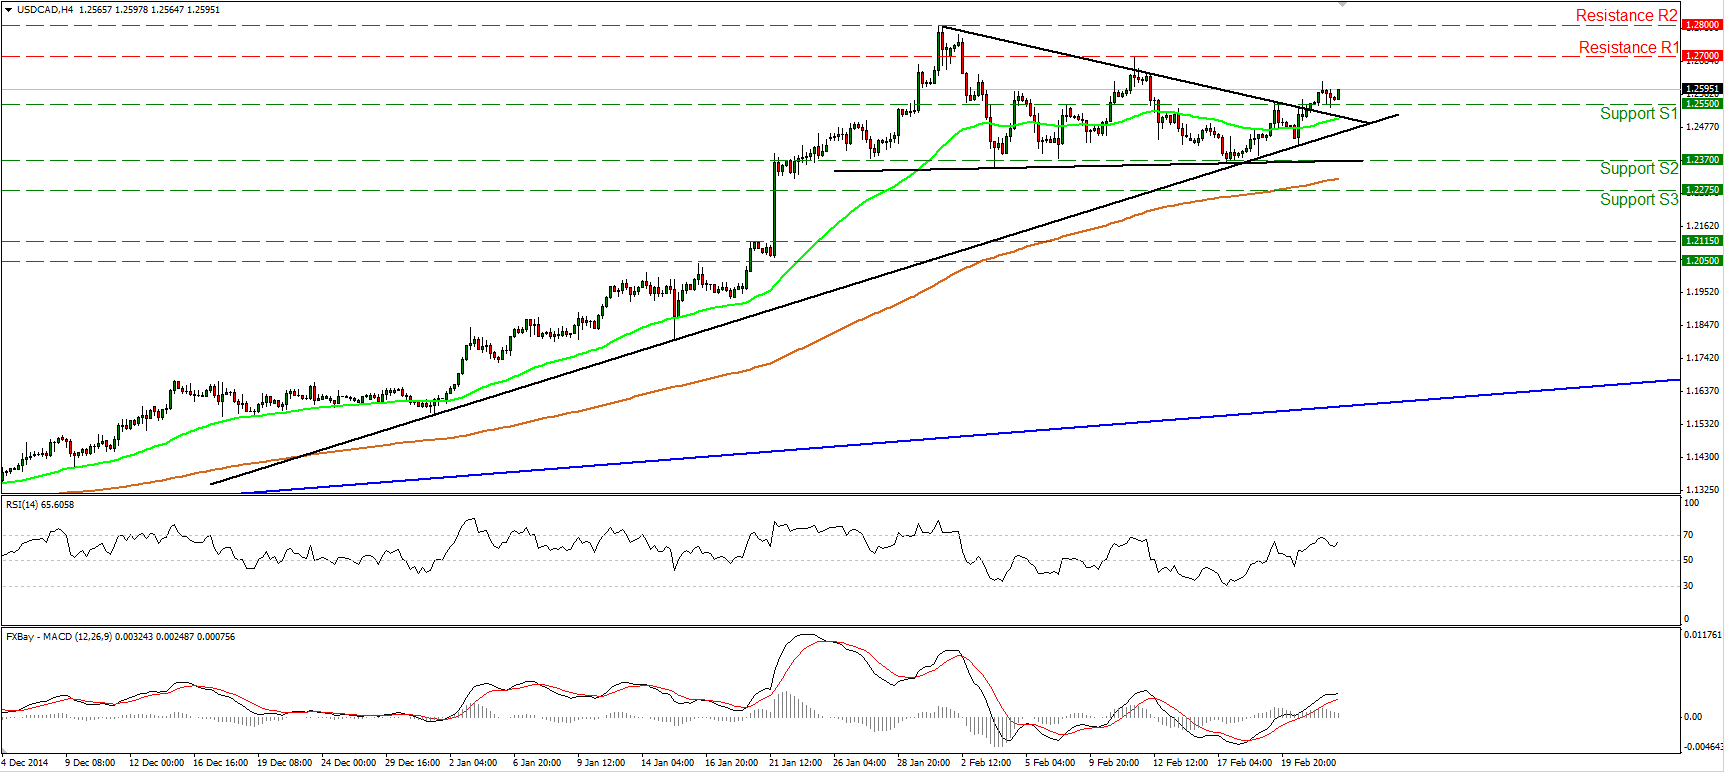
• USD/CAD escaped from a triangle formation and broke above the resistance (now turned into support) barrier of 1.2550 (S1). Having that in mind, and also that the rate stays above the uptrend line taken from back at the low of the 31st of December, I would expect the up wave to continue and challenge the resistance line of 1.2700 (R1), defined by the high of the 11th of February. A break above 1.2700 (R1) could pull the trigger for the high of the 30th of January, at 1.2800 (R2). The catalyst for such a rally may be the release of the Canadian CPI data on Thursday. Inflation is likely to have seen a large slowdown, something that could increase expectations of more aggressive easing from the BoC. On the daily chart, the pair is trading above both the 50- and the 200-day moving averages, and well above the blue uptrend line drawn from the low of the 11th of July. As a result, I see a positive overall picture.
• Support: 1.2550 (S1), 1.2370 (S2), 1.2275 (S3)
• Resistance: 1.2700 (R1), 1.2800 (R2), 1.2900 (R3)
breaks below 1200 but recovers
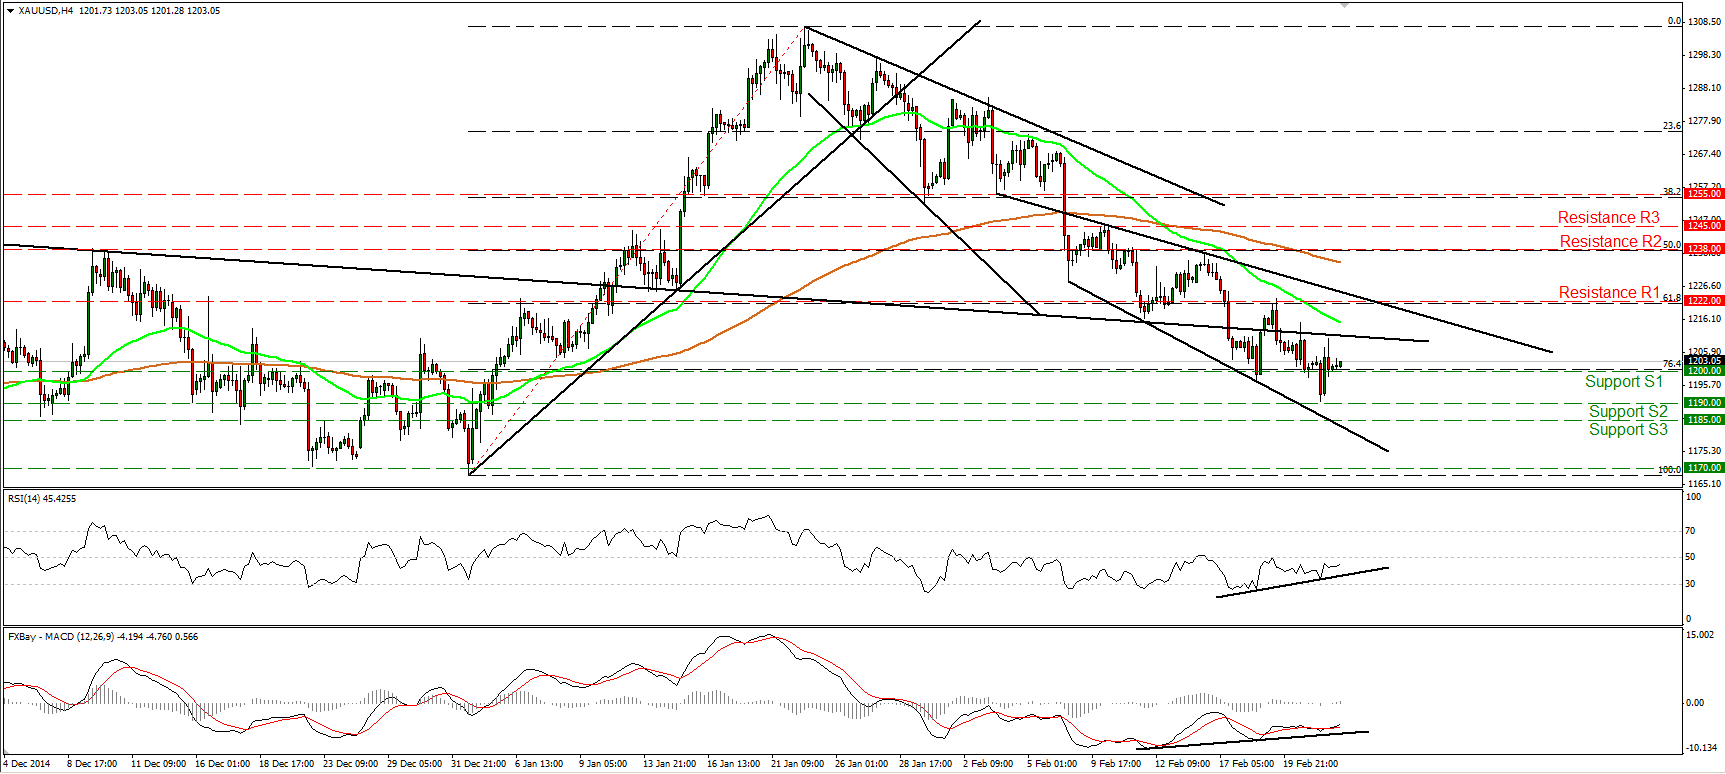
• Gold continued falling on Monday and managed to trade below the psychological line of 1200 (S1), which stands close to the 76.4% retracement level of the 2nd – 22nd of January advance. Nevertheless, the bears were not strong enough to continue the ride down towards our support bar of 1185 (S3). The metal hit support at 1190 (S2) and rebounded to trade again above 1200 (S1). In any case, the price structure on the 4-hour chart still suggests a near-term downtrend, but bearing in mind that there is positive divergence between our short-term oscillators and the price action, I would prefer to take to the sidelines for now. On the daily chart, the move below the neckline of the inverted head and shoulders completed on the 12th of January erased the hopes of the bulls for a rebound near the neckline and strengthened the likelihood for further declines in the not-too-distant future.
• Support: 1200 (S1), 1190 (S2), 1185 (S3)
• Resistance: 1222 (R1), 1238 (R2), 1245 (R3)
WTI sinks below 50.00
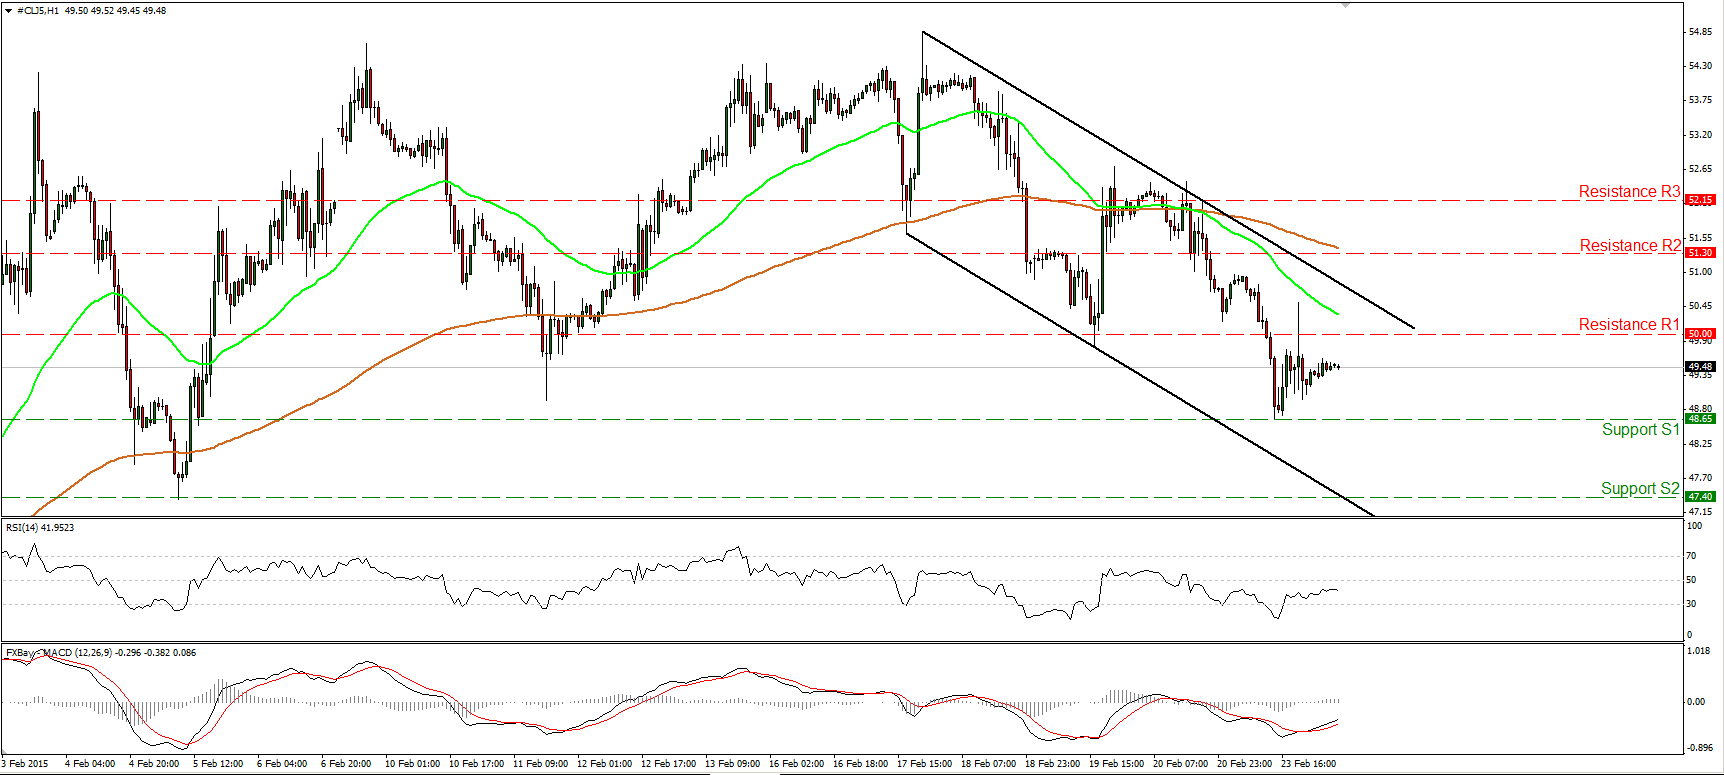
• WTI continued its drop yesterday, breaking below the psychological area of 50.00 (R1) and hitting support at 48.65 (S1). The price structure on the 1-hour chart remains one of lower highs and lower lows within the black downside channel Therefore, I would expect to see another leg down and another test near 48.65 (S1). A clear move below that line could pull the trigger for the 47.40 (S2) hurdle, marked by the low of the 5th of February. On the daily chart, WTI is still trading below both the 50- and the 200-day moving averages. Moreover, the 14-day RSI turned down and fell below its 50 line, while the daily MACD has topped and appears able to move below both its zero and signal lines in the near future. These signs show that the momentum is getting negative again and magnify the case for further declines, at least in the short run.
• Support: 48.65 (S1), 47.40 (S2), 46.65 (S3)
• Resistance: 50.00 (R1) 51.30 (R2), 52.15 (R3)

