The Big Picture
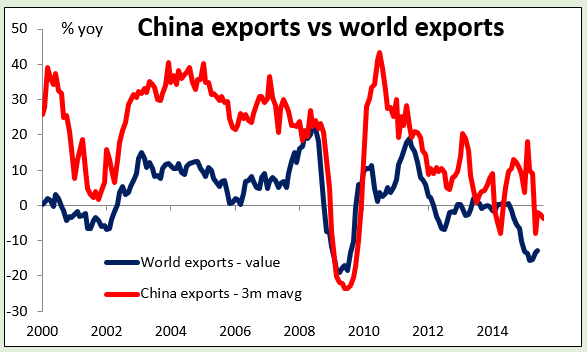
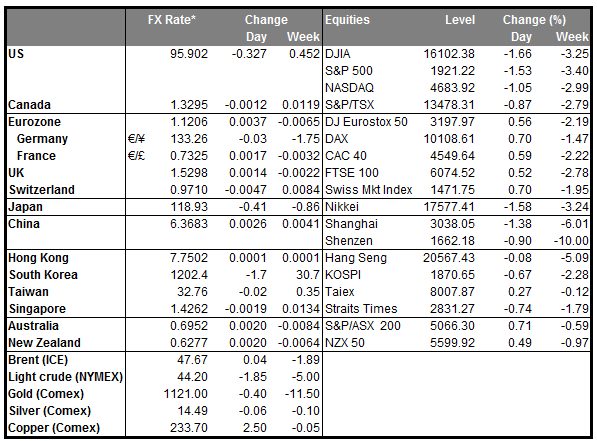
• China’s trade figures show weak demand all around China’s trade balance soared in August, as both exports fell and imports fell sharply. Imports in particular were down 13.8% yoy, almost double the expected pace, although that’s nothing new; they averaged -14.4% yoy each month this year before the August figures were released. Exports were down 5.5% yoy. The figures demonstrate how demand is softening all over the world: both domestic demand in China as construction and investment slow, and demand for China’s exports elsewhere in the world. The figures are bad news for Australia and New Zealand, which count China as their major export market, as well as any number of EM countries that export commodities to China. Weak global demand is likely to increase pressures on all of them to maintain their share of a shrinking pie.
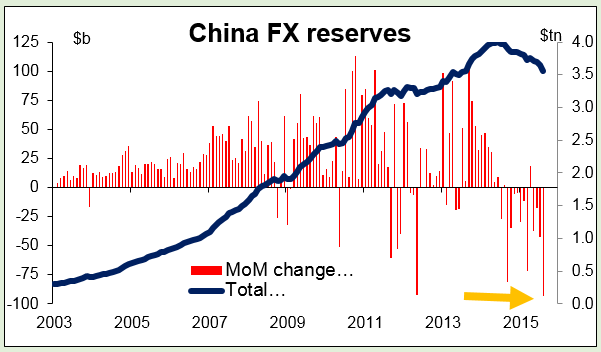
• On the other hand, the sharp fall in imports made for a near-record trade surplus in China ($60.24bn vs the record $60.62bn in February – although that was distorted by the Lunar New Year). That should help to cover any financial outflows and take off some of the downward pressure on the yuan. Paradoxically, it may therefore be beneficial to the Asian currencies that China competes with, at least in the short run. China’s foreign reserves fell a record USD 93.9bn in August as the country intervened to support its currency, despite a devaluation during the month. Given the large trade surplus during the month, this indicates huge capital outflows, which means demand for USD. Also, selling reserves means selling US bonds, which is likely to push up US interest rates, making USD more attractive
• Japan GDP not as bad as was thought Japan’s Q2 GDP fell only 1.2% qoq SAAR in Q2, not as much as the initial estimate of -1.6%. The market had expected the figure to be revised down to -1.8%, so it was a big surprise. But the main contribution to growth was private inventories, meaning that companies are finding it difficult to sell all the goods that they make. This may impede growth in the future. Together with the poor China import data, this led to a decline in the Tokyo stock market. USD/JPY as usual tracked the stock market, meaning that the yen strengthened. Also note a higher-than-expected current account surplus for Japan in July – this may also add to yen strength for some time.
• While I expect the yen to remain a fundamentally weak currency, for now it appears that the EUR may be taking over the yen’s place as a funding currency. That could develop into a period of yen strength until Japanese investors increase their purchases of foreign assets, which I expect will happen once the Fed starts tightening and US bond yields rise.
• Oil down sharply (again) Oil prices fell sharply as Russia ruled out cooperating with OPEC to reduce production. At the same time, several diplomats said sanctions on Iranian oil were likely to be lifted within the first three months of 2016, adding to the global glut. Oh, and China’s oil imports fell 13.4% mom in July, albeit that June was a record level. In any event, it seems to me that oil prices are still extremely vulnerable and therefore so too are the oil currencies, particularly CAD ahead of tomorrow’s Bank of Canada rate decision.
• Today’s highlights: During the European day, Eurozone’s final Q2 GDP is forecast to confirm the preliminary estimate and show that Eurozone’s economy expanded by only 0.3% qoq. Therefore, the market reaction could be minimal at this release, unless we have a huge revision.
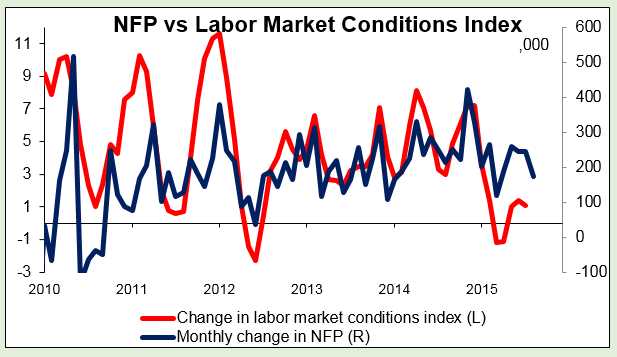
• In the US we get the labor market conditions index for August. This is a monthly index that draws on a range of data to produce a single measure to gauge whether the labor market is on the whole improving. Although not major market mover, the LMCI index will show the broader US labor conditions following the US employment report to be released today. The NFIB small business optimism index for the same month is also due out. Even though this indicator is not a major market mover, it is worth watching because of the Fed’s emphasis on employment, as small businesses employ the majority of people in the US. With less than two weeks to go before the September FOMC meeting, I believe that these two indicators will attract more attention than usual, as they could affect expectations of a September rate lift-off.
The Market
EUR/USD in a sideways path
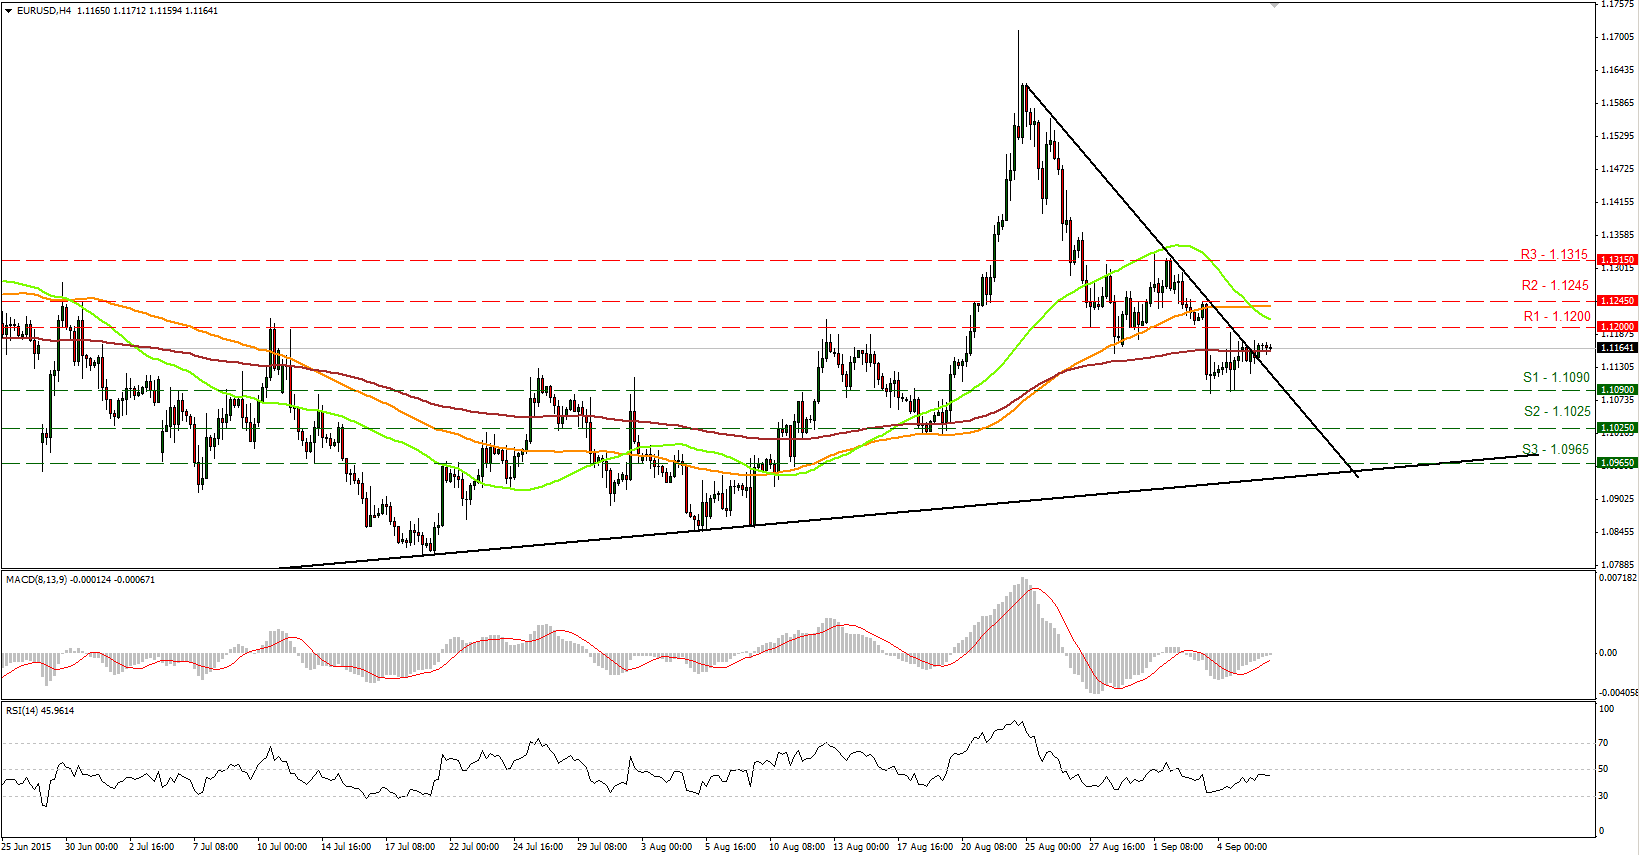
• EUR/USD remained locked in a consolidative mode on Monday, trading within our 1.1090 (S1) support line and the 1.1200 (R1) resistance line. Even though the price moved somewhat higher towards the 1.1200 (R1) resistance line, I still see a negative short-term picture. I believe that a break below 1.1090 (S1) would extend the near-term downtrend and perhaps open the way for the 1.1025 (S2) zone. Looking at our short-term oscillators, the MACD, although above its trigger line, has topped slightly below its zero line and seems willing to move lower. The RSI stands just below its 50 line pointing down. These momentum signs support the notion that the next move is most likely a decline.
• As for the broader trend, given that on the 26th of August EUR/USD fell back below 1.1500, I would maintain my neutral stance. The move below that psychological hurdle confirmed that the surge on the 24th of the month was a false break out. Therefore, I would like to see another move above 1.1500 before assuming that the overall outlook is back positive. On the downside, a break below the 1.0800 hurdle is the move that could shift the picture to negative.
• Support: 1.1090 (S1), 1.1025 (S2), 1.0965 (S3)
• Resistance: 1.1200 (R1), 1.1245 (R2), 1.1315 (R3)
USD/JPY still below 119.65
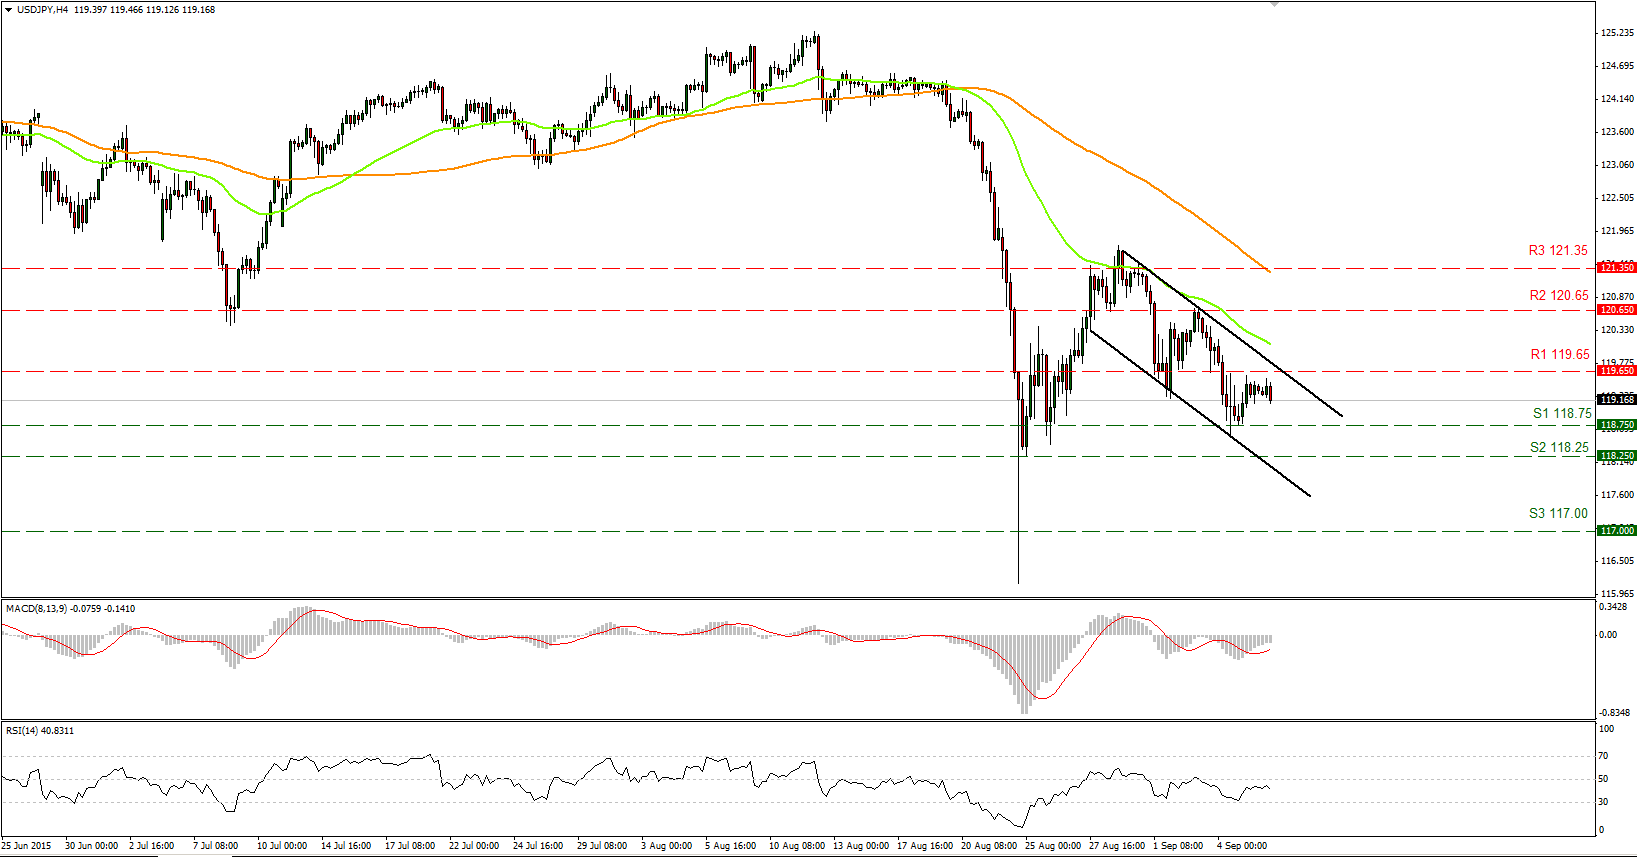
• USD/JPY stayed below our 119.65 (R1) resistance line and is stalling right around the middle of the downslope channel. As long as the rate is trading within that channel, that has been containing the price action since the 28th of August, I would consider the short-term trend to be negative. I would expect the failure to move above 119.65 (R1) to aim once again for the 118.75 (S1) support line. A break below that line could see scope for extensions towards 118.25 (S2).
• As for the broader trend, the plunge on the 24th of August signaled the completion of a possible double-top formation, which probably shifted the medium-term picture negative.
• Support: 118.75 (S1), 118.25 (S2), 117.00 (S3)
• Resistance: 119.65 (R1), 120.65 (R2), 121.35 (R3)
GBP/USD heads towards the key resistance of 1.5330
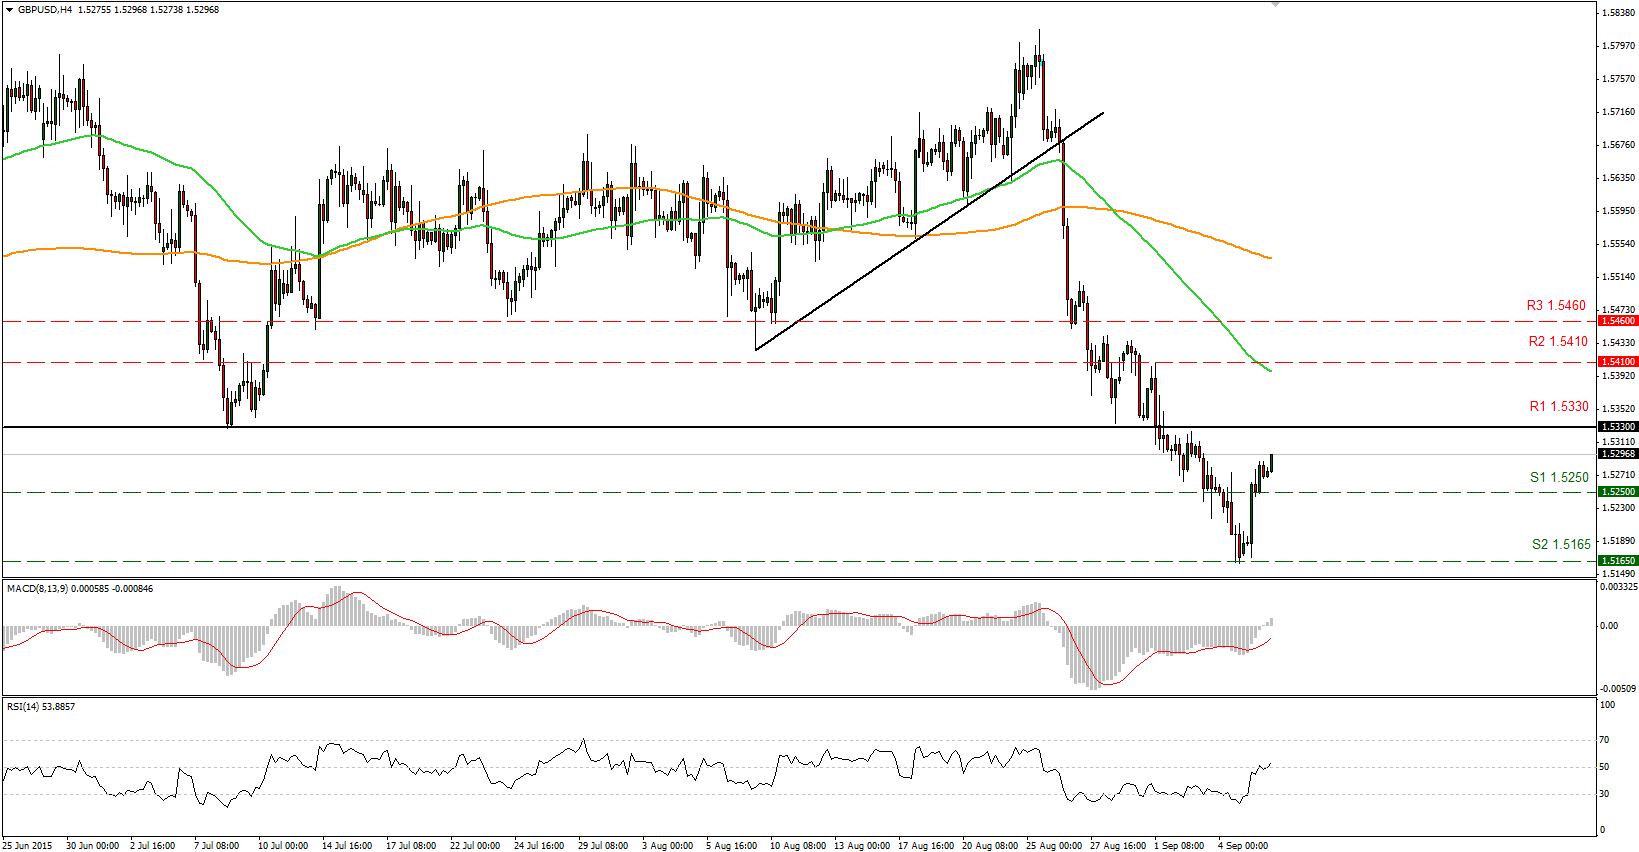
• GBP/USD broke above our resistance-turned-into-support of 1.5250 (S1) and during the early European trading session, the pair heads towards the key resistance of 1.5330 (R1). A break above that level is needed to trigger further extensions towards our next resistance of 1.5410 (R2). Our short-term momentum indicators support the notion as well. The RSI broke above its 50 line and moved higher, while the MACD, already above its trigger line, poked its nose above the zero line.
• As for the bigger picture, the collapse on the 26th of August brought the rate back below the 80-day exponential moving average. What is more, the move below 1.5330 (R1) confirmed a forthcoming lower low on the daily chart, which shifts the overall outlook cautiously to the downside, in my view. This is why I need a break above that level to trust that further advances could be looming.
• Support: 1.5165 (S1), 1.5090 (S2), 1.5000 (S3)
• Resistance: 1.5250 (R1), 1.5330 (R2), 1.5410 (R3)
WTI found support at the uptrend line
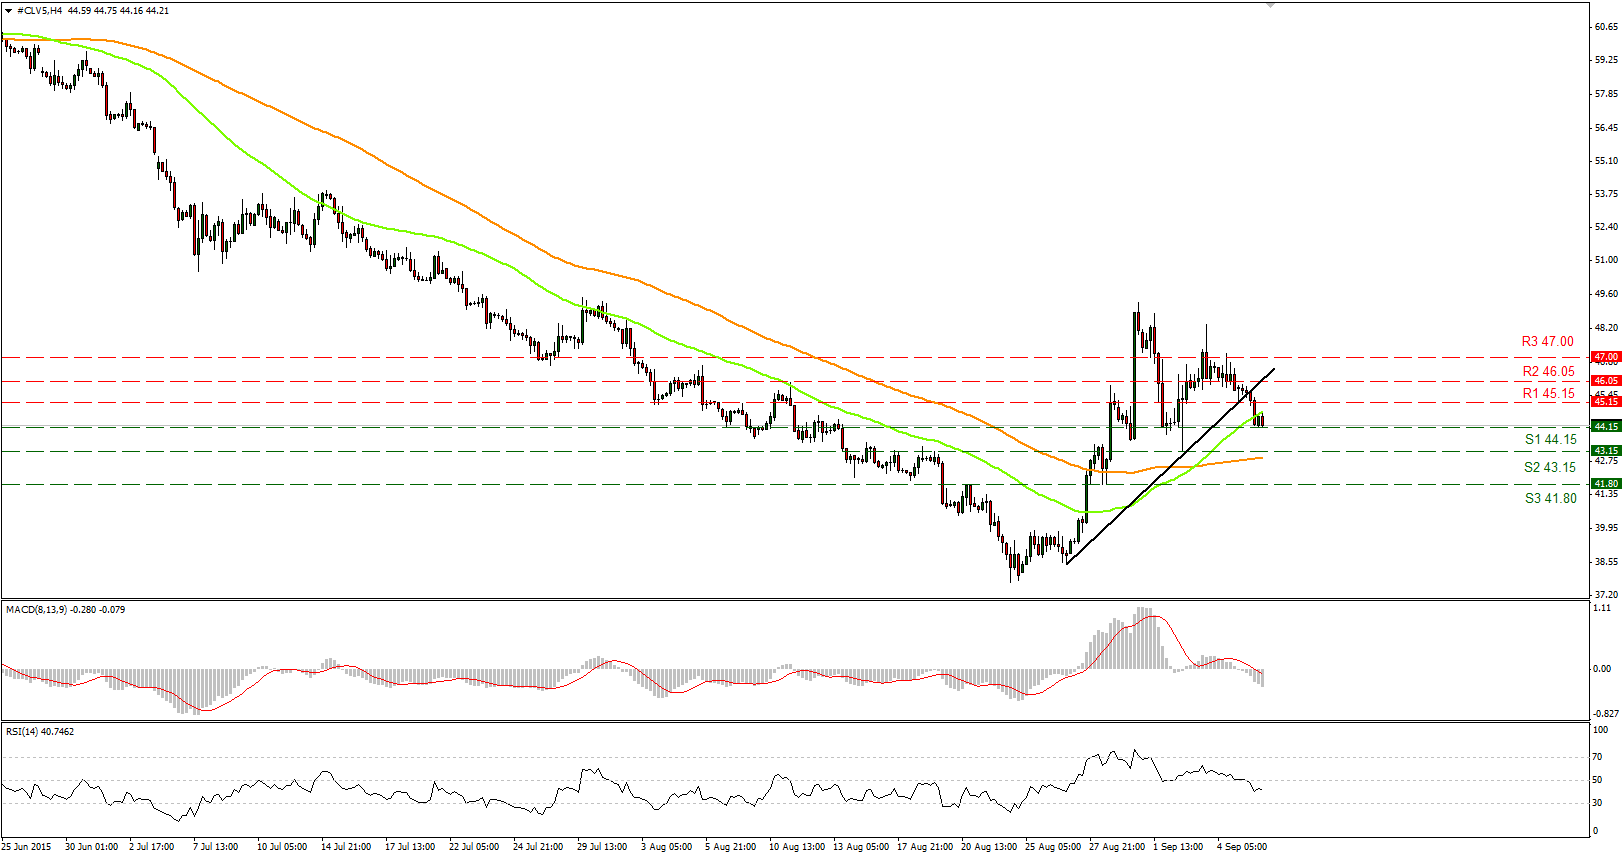
• WTI traded lower on Monday, breaking below our support (now turned into resistance) of 45.15 (R1) and the uptrend line taken from the low of the 26th of August. Since the price broke below that line, I would shift my view to neutral now and wait for a break below 44.15 (S1) to signal further declines. A break below that hurdle is needed to extend the decline, perhaps towards our next support of 43.15 (S2). Our short-term momentum studies detect a negative momentum amplifying the case for a leg lower. The RSI fell below the 50 line and moves towards the 30 level, while the MACD, stands below its trigger and zero lines.
• On the daily chart, I still see a longer-term downtrend. As a result, I would treat the 26th – 31st of August advance as a corrective move of that major downside path.
• Support: 45.15 (S1), 44.15 (S2), 43.15 (S3)
• Resistance: 46.05 (R1) 47.00 (R2), 48.40 (R3)
Gold still in a consolidation mode
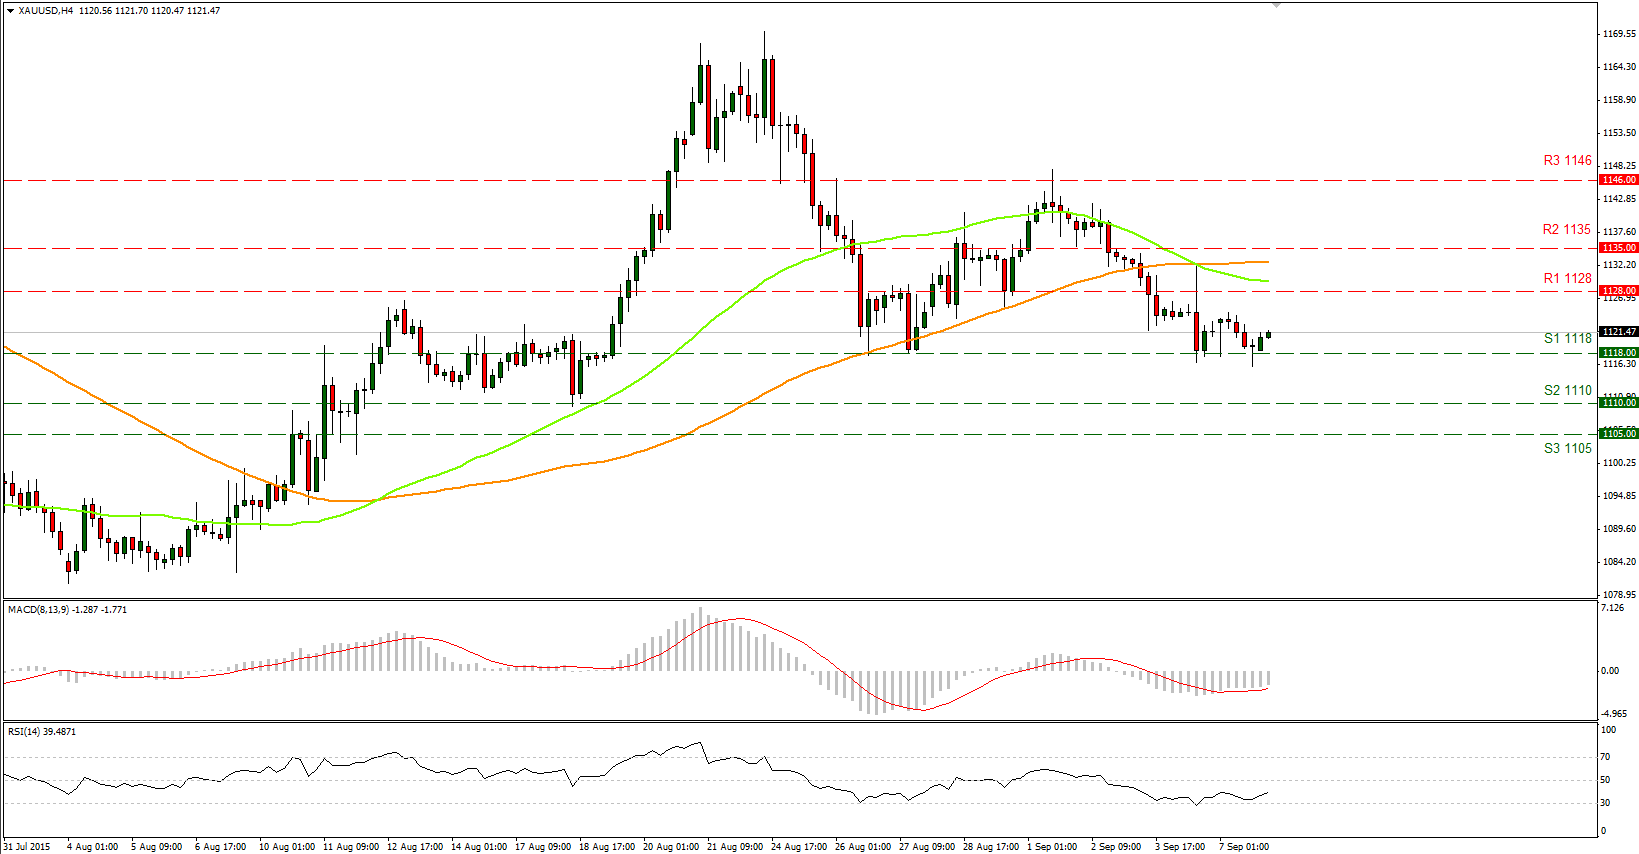
• Gold is still moving within a sideways path, within a tight range between the 1128 (R1) resistance line and the 1118 (S1) support level. I believe that a break in either direction is likely to determine the forthcoming near-term bias. Looking at our short-term oscillators, I believe that the next wave is most likely to be lower. The RSI found resistance slightly below the 50 level, while the MACD, already below its zero line, seems ready to cross below its trigger line. The momentum evident in these indicators supports my view that the next move could be to the downside. A break below the 1118 (S1) hurdle is likely to target our next support at 1110 (S2).
• As for the broader trend, with no clear trending structure on the daily chart, I would hold my neutral stance as far as the overall outlook is concerned.
• Support: 1118 (S1), 1110 (S2), 1105 (S3)
• Resistance: 1128 (R1), 1135 (R2), 1146 (R3)

