Get 40% Off
🚨 Volatile Markets? Find Hidden Gems for Serious OutperformanceFind Stocks Now

Intraday Outlooks: EUR/USD, EUR/JPY, EUR/GBP, AUD/NZD

Published 01/26/2015, 06:15 AM
Updated 07/09/2023, 06:31 AM

The following are the intraday outlooks for EUR/USD, EUR/JPY, EUR/GBP, and AUD/NZD as provided by the technical strategy team at SEB Group.

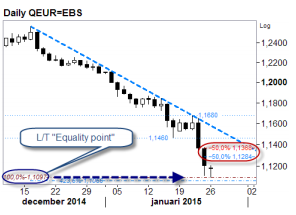
EUR/USD: Testing a long-term 'Equality point'. The correctional rally will likely be sold. The Greek election kicked the euro into a marginally fresh low where a long-term (2011-2014) 'Equality point' likely inspired some buying - no wonder with short-term conditions are stretched as they currently are. But it's less likely that this is enough to scale down further expanded spec shorts (IMM). The near-term rebound faces daily & weekly mid-body points at 1.1285 & 1.1370.

Daily EUR Chart

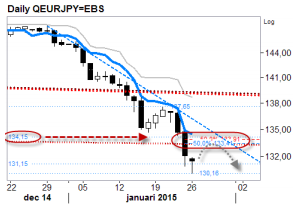
EUR/JPY: Could recheck the mid/high 133s. Too low too fast? - Possibly... The move above local resistance at 132.95 could trigger some light profit-taking and thus set in motion a short-lived reaction to test offers at resistance (133.40/134.15) before selling resumes. Current intraday stretches are located at 130.50 & 133.20.

EUR/JPY Daily Chart

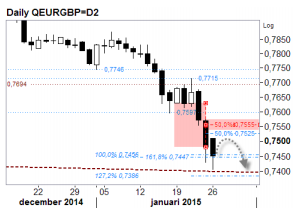
EUR/GBP: Some support at a L/T trendline. A descending 2010-2012 trendline ought to inspire some profit-taking when conditions are so short-term stretches as they currently are. But the bounce may become both short & shallow with daily and weekly mid-body points at 0.7525/55 providing presumed resistance.

EUR/GBP Daily Chart

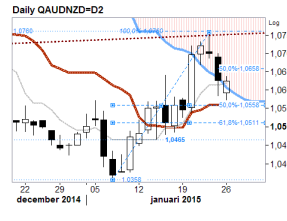
AUD/NZD: Buyers respond to healthy correction. A short-term 'Equality point', long-term trendline recheck and the bearishly tilted short-term 'Cloud' triggered an earlier correction lower which seems to be fading at a short-term 50% retracement ref and the Fibo-adjusted 'Tenkan-Sen' in the mid-1.05s. Buyers' initiative over Fri's 1.0660 mid-body point would once again expose the 1.0760 ref. Additional supports are located at 1.0510 & 1.0465.

3rd party Ad. Not an offer or recommendation by Investing.com. See disclosure here or remove ads .

AUD/NZD Daily Chart

Original post

Latest comments

Risk Disclosure: Trading in financial instruments and/or cryptocurrencies involves high risks including the risk of losing some, or all, of your investment amount, and may not be suitable for all investors. Prices of cryptocurrencies are extremely volatile and may be affected by external factors such as financial, regulatory or political events. Trading on margin increases the financial risks.
Before deciding to trade in financial instrument or cryptocurrencies you should be fully informed of the risks and costs associated with trading the financial markets, carefully consider your investment objectives, level of experience, and risk appetite, and seek professional advice where needed.
Fusion Media would like to remind you that the data contained in this website is not necessarily real-time nor accurate. The data and prices on the website are not necessarily provided by any market or exchange, but may be provided by market makers, and so prices may not be accurate and may differ from the actual price at any given market, meaning prices are indicative and not appropriate for trading purposes. Fusion Media and any provider of the data contained in this website will not accept liability for any loss or damage as a result of your trading, or your reliance on the information contained within this website.
It is prohibited to use, store, reproduce, display, modify, transmit or distribute the data contained in this website without the explicit prior written permission of Fusion Media and/or the data provider. All intellectual property rights are reserved by the providers and/or the exchange providing the data contained in this website.
Fusion Media may be compensated by the advertisers that appear on the website, based on your interaction with the advertisements or advertisers.
© 2007-2024 - Fusion Media Limited. All Rights Reserved.