For the fourth consecutive week, a major institution issued a negative report regarding global growth. This time it was the IMF, who, in a report titled, “Rise in Emerging Market Corporate Debt Driven by Global Factors,” noted the large build-up in emerging market debt may careen out of control as EM currencies decline and trade slows. Nonfinancial company debt in emerging economies increased from $4 trillion to $18 trillion between 2004 and 2014. Chinese raw material demand, low interest rates in developed countries and rising commodity prices spurred the trend. But as all three trends reverse course, companies that issued the debt face a potential triple whammy of declining home country currency values, declining revenue and increasing developed market interest rates negatively impacting their respective balance sheets. It’s possible this situation has started as some sovereign EM debt is already trading at higher levels seen in 2013’s “taper tantrum.”
In a recent speech, Bank of Japan Governor Kuroda offered the following positive view of the Japanese economy:
Japan's economy has continued to recover moderately with a virtuous cycle from income to spending operating in both the corporate and household sectors, although exports and production are affected by the slowdown in emerging economies. That is, in the corporate sector, profits have marked a record high and firms' fixed investment stance has been positive. In the household sector, wages have been growing -- as seen in the rise in base pay for two consecutive years in a situation where the unemployment rate has declined to the level that can be regarded as almost corresponding to "full employment" -- and private consumption has been resilient.
His analysis is more hopeful than current statistics warrant. Governor Kuroda’s optimism is based on the Tankan survey:
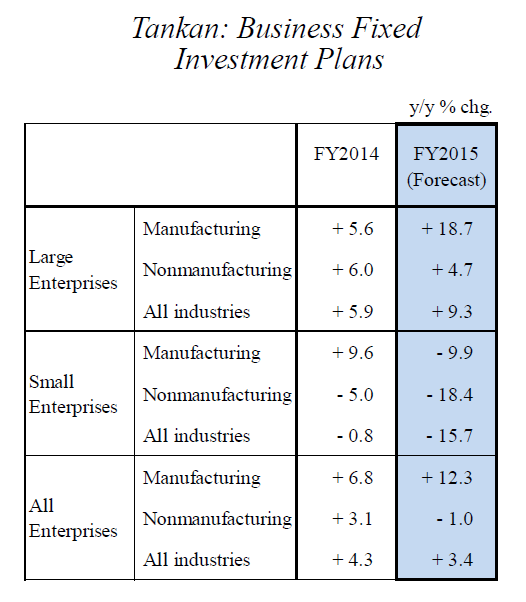
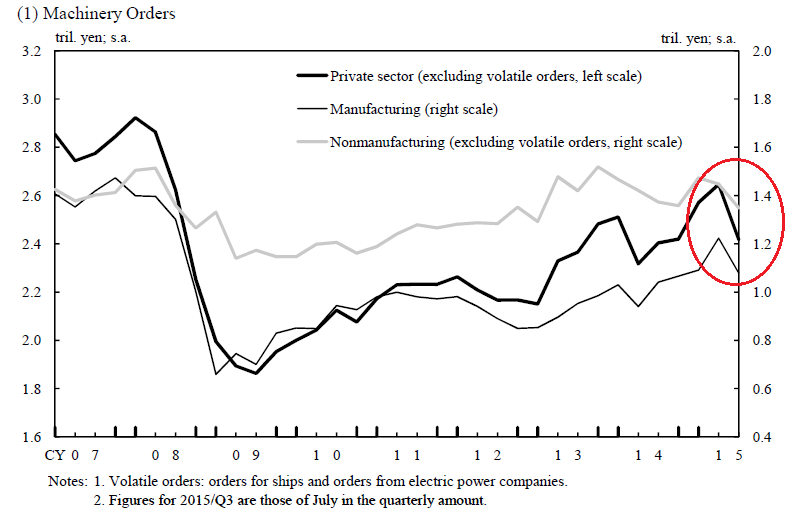
While these readings are positive, they are prospective, not commitment of funds. In fact, machinery orders are down in the 1H15:
And although corporate profits are high, actual investment is not as strong as indicated:
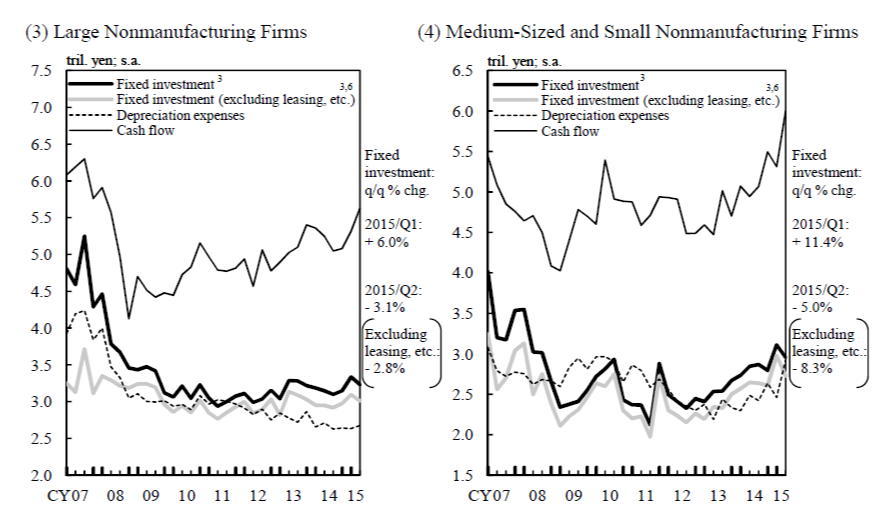
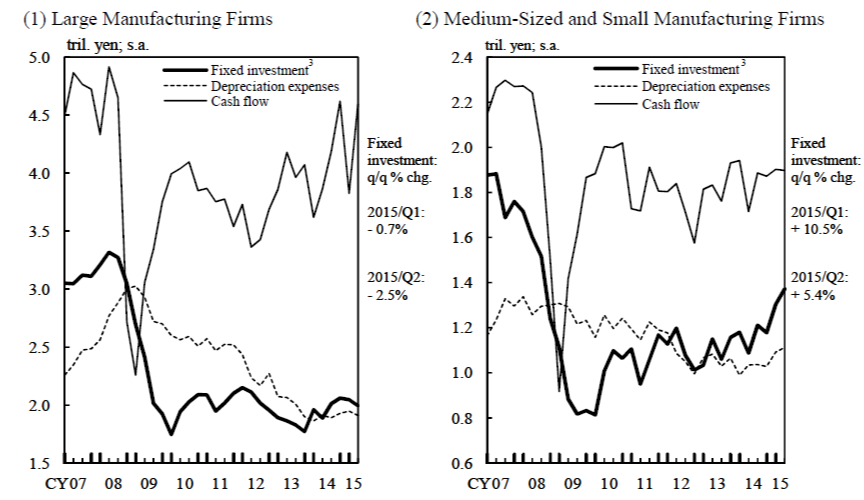
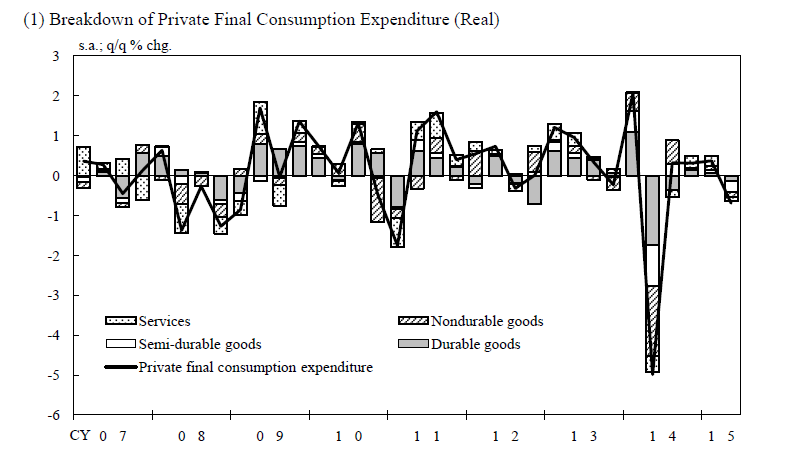
In the latest reading, large and medium/small non-manufacturers saw capital investment decreases of -3.1% and -5% respectively. The respective numbers for large and medium/small manufactures were -2.5% and +5.4%. And both data sets are far below pre-recession levels. As for consumers, although wages increased in the latest quarterly reading, consumption expenditures sharply decreased in the 2Q15:
And the Governor’s statements stand in stark contrast to those of Etsuro Honda, a top aide to Prime Minister Abe, who stated Japan needed additional fiscal stimulus to insulate the country from China’s slowdown. This statement highlighted the ongoing Japanese weakness, best shown by their CEIs:
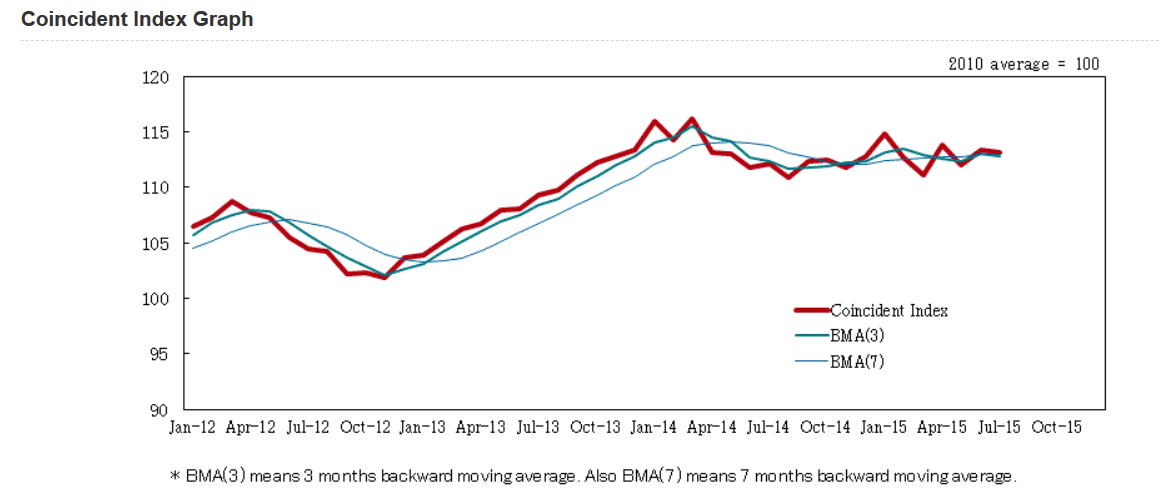
The index has moved sideways for the last year-and-a-half, indicating the economy has no momentum. Other recently released statistics are not encouraging. Construction orders dropped 15.6% Y/Y – their fourth decline in five months. Industrial production decreased .5%, the seventh decline in the last eight months. Overall, Japanese news is slowing becoming more negative.
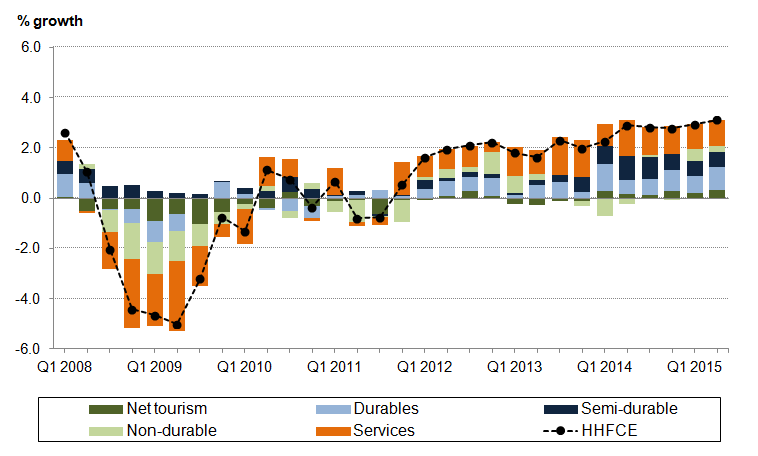
The main news from the UK was the third and final GDP revision, which the ONS reported at 2.4% Y/Y. UK consumers also continue to spend at a solid clip, buying a broad mix of goods and services:
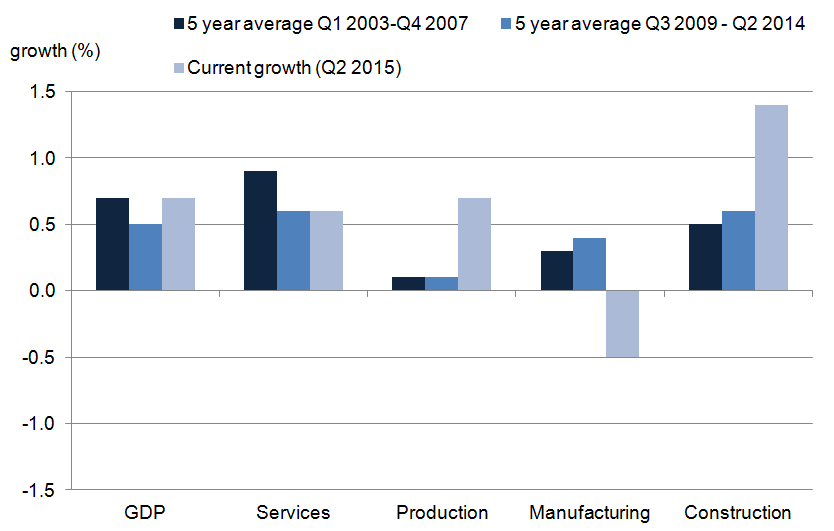
While manufacturing was down for the last two quarters, services and construction continue to grow. In fact, the five years averages for both sectors indicates they are the primary source of post-recession UK growth:
Canada has avoided a recession: their GDP increased .3% in July following a .4% increase in June. June’s positive number followed five consecutive months of contraction:
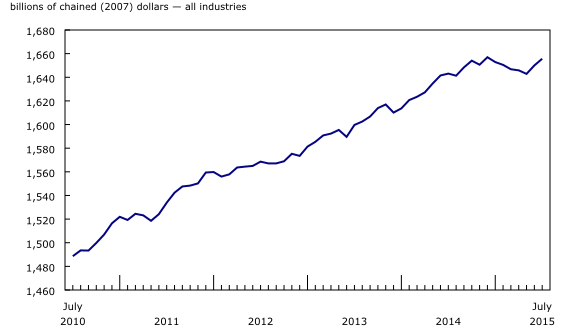
Mining, quarrying and oil extraction provided the primary lift:
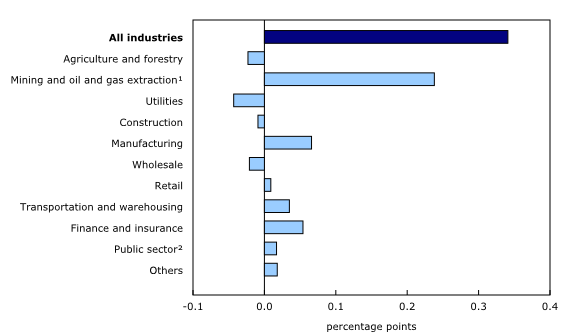
After increasing 2.9% in June, oil and gas extraction rose 4.4% in July mainly as a result of a 9.1% gain in non-conventional oil extraction. Non-conventional oil extraction continued to grow in July after increasing 7.0% in June, following maintenance shutdowns and production difficulties in April and May. Conventional oil and gas extraction was up 0.8% in July after edging up 0.1% in June.
Canada is far from out of the woods. They are one of the largest resource export dependent DM countries, making them especially vulnerable to recent commodity weakness. And there is little sign commodity weakness is near the end.
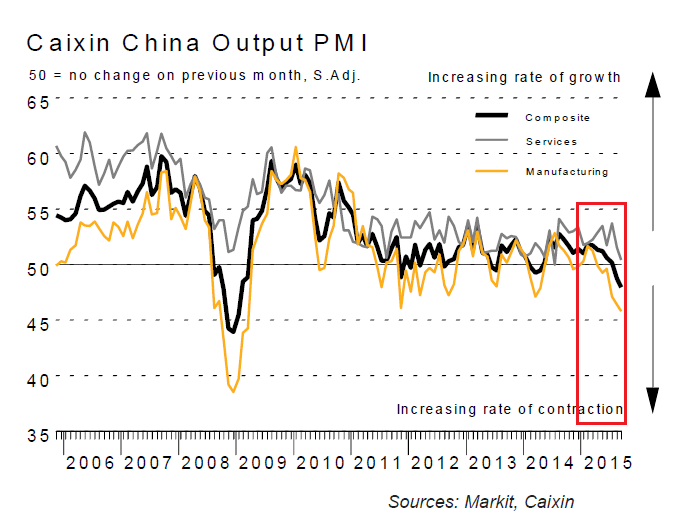
The only news from China was bearish, where the manufacturing sector is contracting sharply:
Latest survey data signalled the quickest deterioration in operating conditions faced by Chinese manufacturers since March 2009. Total new work fell at the quickest rate in over three years, partly driven by a steeper fall in new export business. As a result, companies cut output at the sharpest rate in six-and-a-half years, while staff numbers fell at the quickest pace since the start of 2009. Reduced production schedules also prompted firms to lower their purchasing activity again in September, while disappointing sales led to the strongest increase in stocks of finished goods for over three years. On the price front, both input costs and output charges fell at sharper rates.
Above is a clear explanation of the “un-virtuous” cycle: new orders drop, leading to output declines and increased layoffs. Services are barely positive: their latest readings decreased from 51.5 to 50.5. The end result is a disturbing graph: manufacturing appears to be leading the composite index lower:
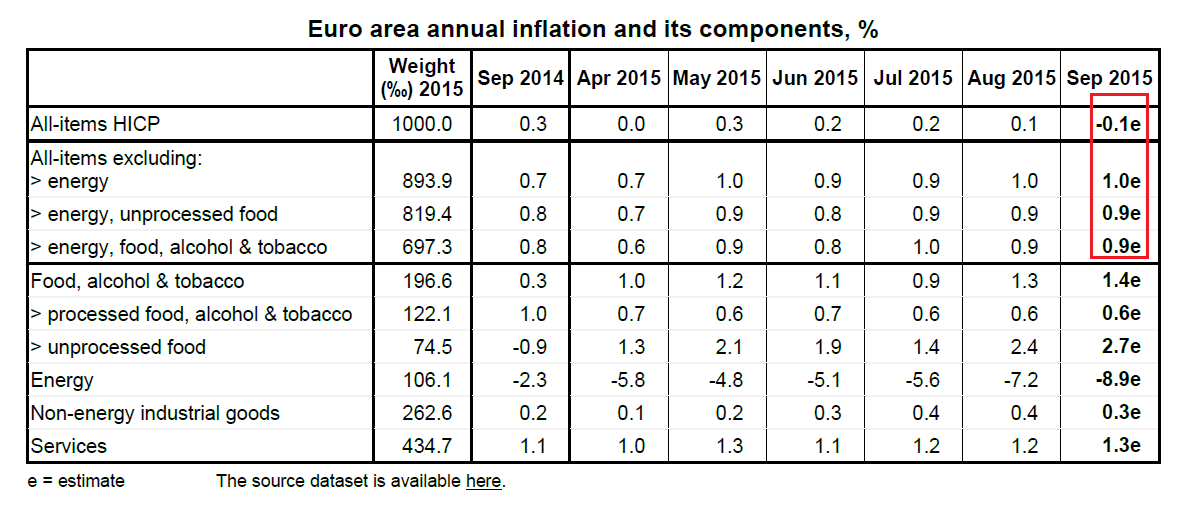
EU news was largely positive. Although annual inflation was -.1%, the core rate was .9%, giving hope to EU policy makers that the HICP rate will rise once commodities catch a bid:
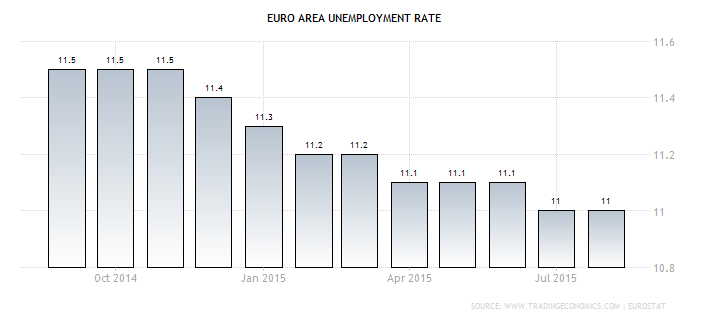
Eurostat reported an unemployment rate of 11%. This statistic continues its agonizingly slow move lower:
However, overall manufacturing is still a positive 52.
Overall, the tone of news continues to lean negative. China continues to slow. Japan is clearly having problems regaining momentum after last year’s sales tax increase and Canada just missed being in a technical recession. The EU and UK are growing moderately, but not impressively. And it appears even the US is starting to import some of the global weakness.
