Get 40% Off
🚨 Volatile Markets? Find Hidden Gems for Serious OutperformanceFind Stocks Now

Indicative Moving Averages: It's Different This Time

Published 10/11/2015, 01:01 AM
Updated 07/09/2023, 06:31 AM

I’m getting uncomfortable pounding on the same theme over and over again (there’s only so many times I can point out the large, looming topping patterns across the board), so I thought I’d mix things up a bit and just get off the price bars entirely and catch up on a trio of exponential moving averages to show how things have turned south, irrespective of the gargantuan, quadruple-point rally on the Dow. Here are the Dow Industrials:
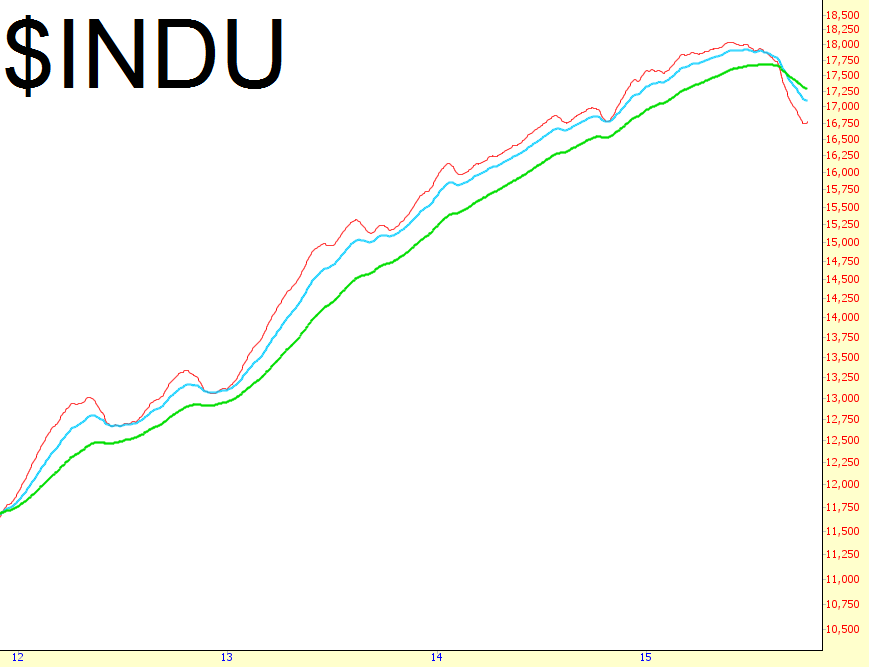
INDU Chart

The even-more-important Dow Composite:
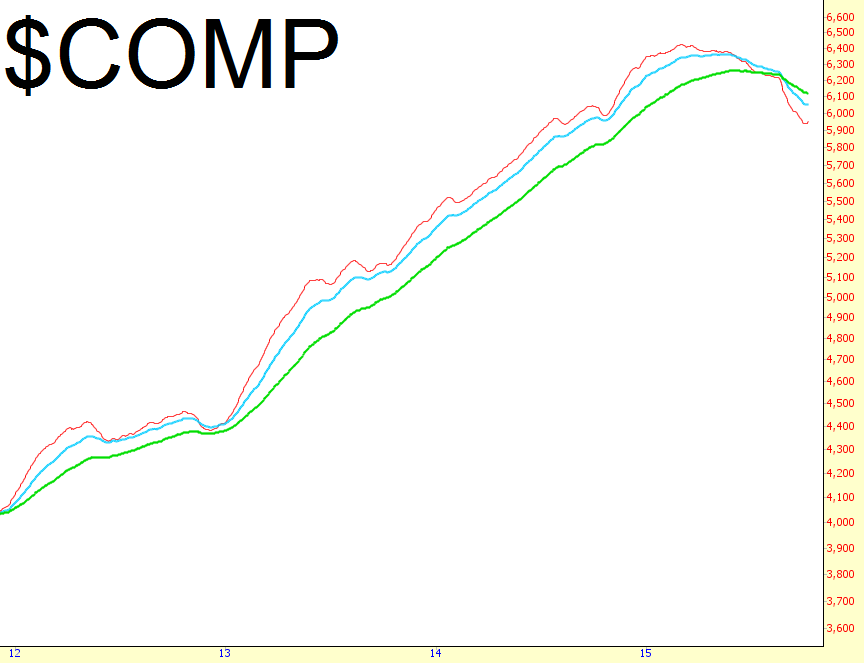
COMP Chart

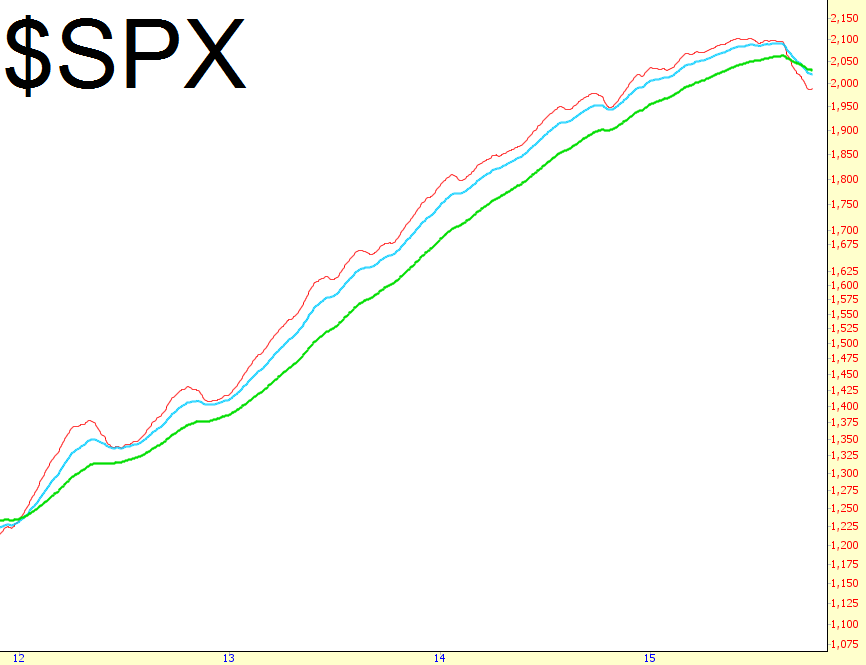
And the S&P 500:

SPX Chart

I’ll be the first one to admit that the moving averages looked very similar to this in October 2011, after which time we simply kept soaring higher. But – dare I say it? – it’s different this time! OK, OK, stop throwing rotten vegetables at me. I’m serious.

Even more enticing to me is the shape of the energy sector, which has been simply nuked:
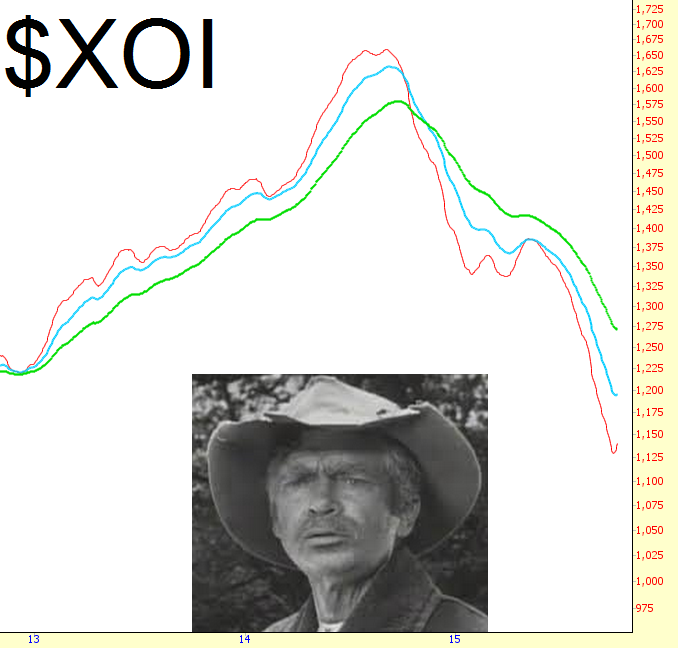
XOI Chart

I have vastly expanded my short holdings over the course of this week, and if we (finally) start re-weakening this week, I’m going to augment my favorite positions. As I suggested, my favorite sector is (once again) energy, as giants like Exxon (NYSE:XOM) are exhibiting topping patterns that strike me as once-a-generation type opportunities.
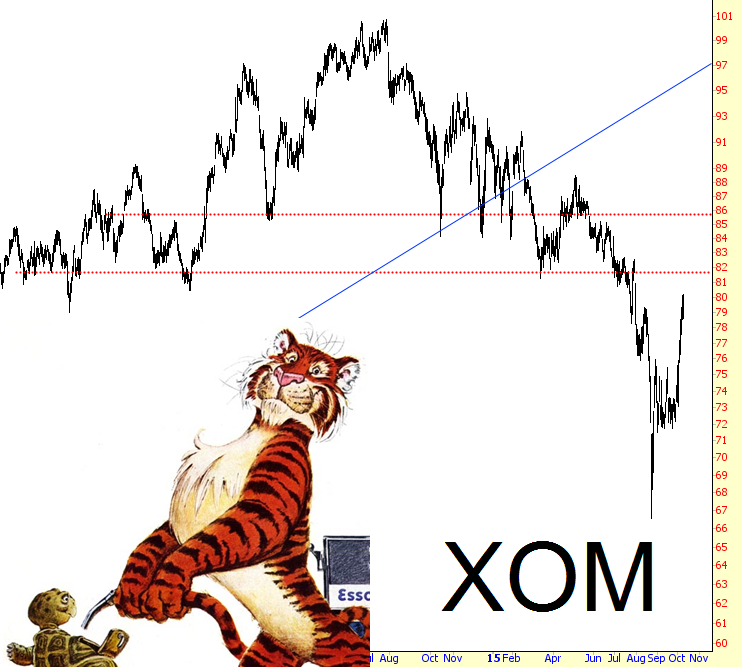

XOM Chart

Latest comments

Risk Disclosure: Trading in financial instruments and/or cryptocurrencies involves high risks including the risk of losing some, or all, of your investment amount, and may not be suitable for all investors. Prices of cryptocurrencies are extremely volatile and may be affected by external factors such as financial, regulatory or political events. Trading on margin increases the financial risks.
Before deciding to trade in financial instrument or cryptocurrencies you should be fully informed of the risks and costs associated with trading the financial markets, carefully consider your investment objectives, level of experience, and risk appetite, and seek professional advice where needed.
Fusion Media would like to remind you that the data contained in this website is not necessarily real-time nor accurate. The data and prices on the website are not necessarily provided by any market or exchange, but may be provided by market makers, and so prices may not be accurate and may differ from the actual price at any given market, meaning prices are indicative and not appropriate for trading purposes. Fusion Media and any provider of the data contained in this website will not accept liability for any loss or damage as a result of your trading, or your reliance on the information contained within this website.
It is prohibited to use, store, reproduce, display, modify, transmit or distribute the data contained in this website without the explicit prior written permission of Fusion Media and/or the data provider. All intellectual property rights are reserved by the providers and/or the exchange providing the data contained in this website.
Fusion Media may be compensated by the advertisers that appear on the website, based on your interaction with the advertisements or advertisers.
© 2007-2024 - Fusion Media Limited. All Rights Reserved.