Sterling has fallen nearly six cents since the September 1, or about 3.2%. The reason is clear, and it is most certainly not simply about good news from the US.
Sterling had already fallen six cents from this mid-July high near $1.72 as the market adjusted to the latest forward guidance, which seemed to argue against Q4 14 rate hike. The economy was also moderating from a strong H1.
However, much of the adjustment had taken place by late August, and on September 1, sterling traded at an 8-day high, closing above $1.66 for the first time since August 19. Soft than expected August manufacturing PMI on September 2 got the ball rolling again. The 52.5 reading was the lowest since mid-2013. Also some housing price indices showed some cooling off as well. Sterling finished last week just below $1.6330.

It was the weekend YouGov poll that showed not just a tightening of the Scottish vote, but put the independents ahead for the first time (when the undecided were excluded). Sterling gapped lower in Asia, leaving a half a cent of space not traded between $1.6233 (Monday's high according to Bloomberg) and $1.6283, the pre-weekend low.
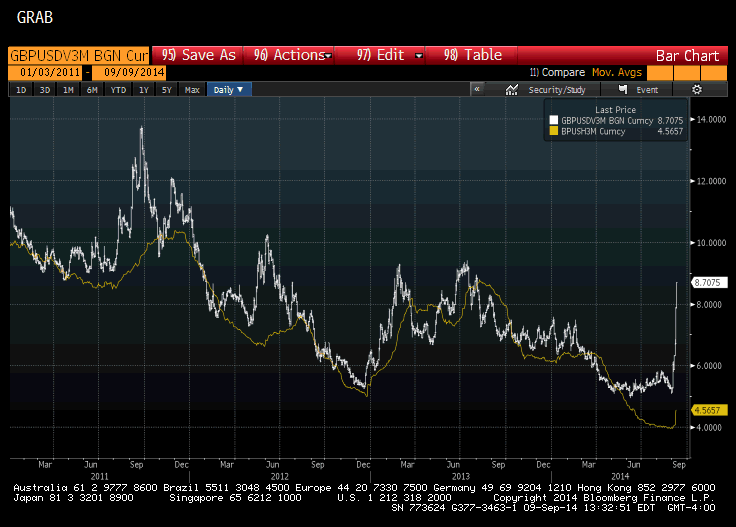
Three-month implied volatility has jumped from 6.7% at the end of last week to 8.7% today. It had finished August near 5.15%. Recall implied volatility is the measure of volatility embedded in the price of an option. It jumped not so much because historic volatility jumped, but because, it would seem, investors were demanding protection, and were buying sterling puts.
This is also "confirmed" by the performance of the risk reversals. Put-call parity states that options equidistant from the forward strike should trade at the same price. To the extent they do not, it reflects a skew. At the end of August calls traded at a 0.5% discount to puts. Now they trade at a 1.82% discount, the largest since mid-2012.
This Great Graphic, composed on Bloomberg, shows the evolution of the three-month implied volatility (white line) and the historic volatility (yellow line). Historic volatility has clearly risen but remains close to the 4% trough. One explanation for this gap is that many participants continue to see positive sterling fundamentals. The BOE may still raise rates before the Federal Reserve, and in any event, is doing considerably better than the euro zone or Japan. These participants want protection, and more protection than selling a call can provide. They are seeking insurance and have had to pay up for it. The risk is that a "yes victory leads to another sharp down move in sterling. We have highlighted the technical risk that a break of $1.60 could spur a move to $1.5725, and then possibly $1.51.
