Gold has performed very well under the circumstances of declining inflation and a surging US dollar Index. Since 2014 the US dollar index is up nearly 18% while gold is up 3%. Since gold’s November low the US dollar index is up over 10%. Had we known that at the time, we’d have thought gold would be headed for $1000 and not the $1300 it recently hit. At present, the US dollar index appears ripe for a correction or major pause in its uptrend. Given that gold is priced in US dollars and that gold has shown strength in real terms, sustained US dollar weakness could be a major boon for gold and precious metals as a whole.
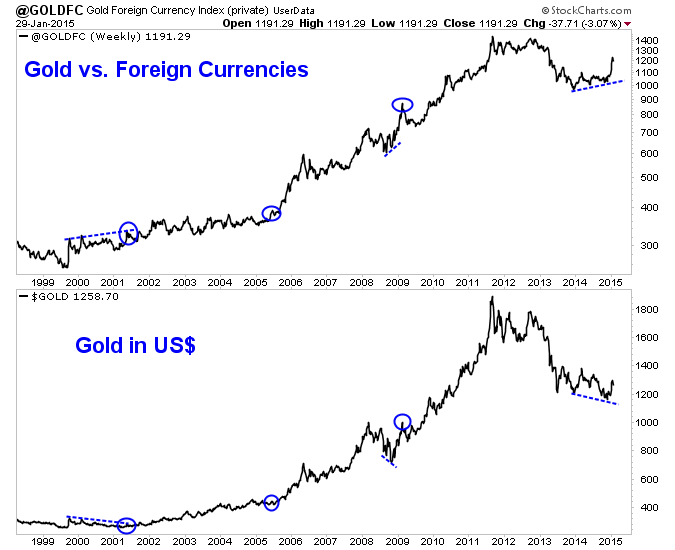
Before we get to the US dollar, I’d like to provide a comparison of gold and gold charted against foreign currencies. To create the foreign currency index we simply took US dollar data and inverted it. Thus, we are charting gold against the currency basket that comprises the US dollar index. Over the past 15 years strength in gold relative to foreign currencies has often preceded gold strength in US dollars. Gold priced against foreign currencies bottomed in December 2013 and reached a 21-month high last week.

Gold vs. Foreign Currency Basket & Gold in US dollars
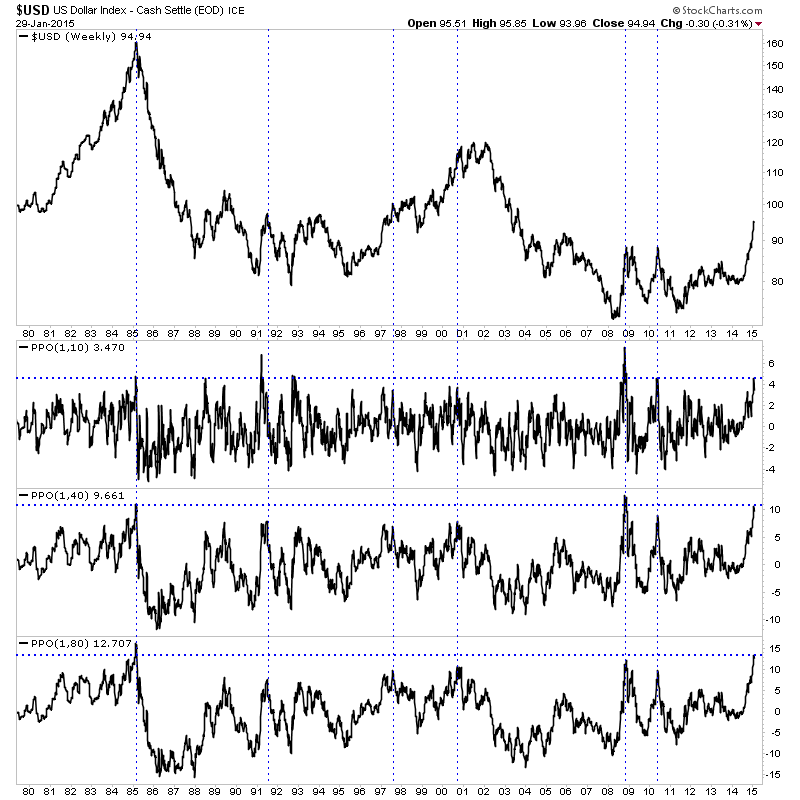
Let’s take a look at the US dollar index. We plot the index and its distance from its 10, 40 and 80-week exponential moving averages. A market’s distance from various moving averages can signal overbought and oversold conditions. We highlight the points at which the US dollar index has been most overbought. Considering the three oscillators as a whole, the US dollar index is arguably at its third most overbought point since the US dollar floated in 1971. The other times were at its peak in early 1985 and during the 2008 financial crisis.

US dollar Index
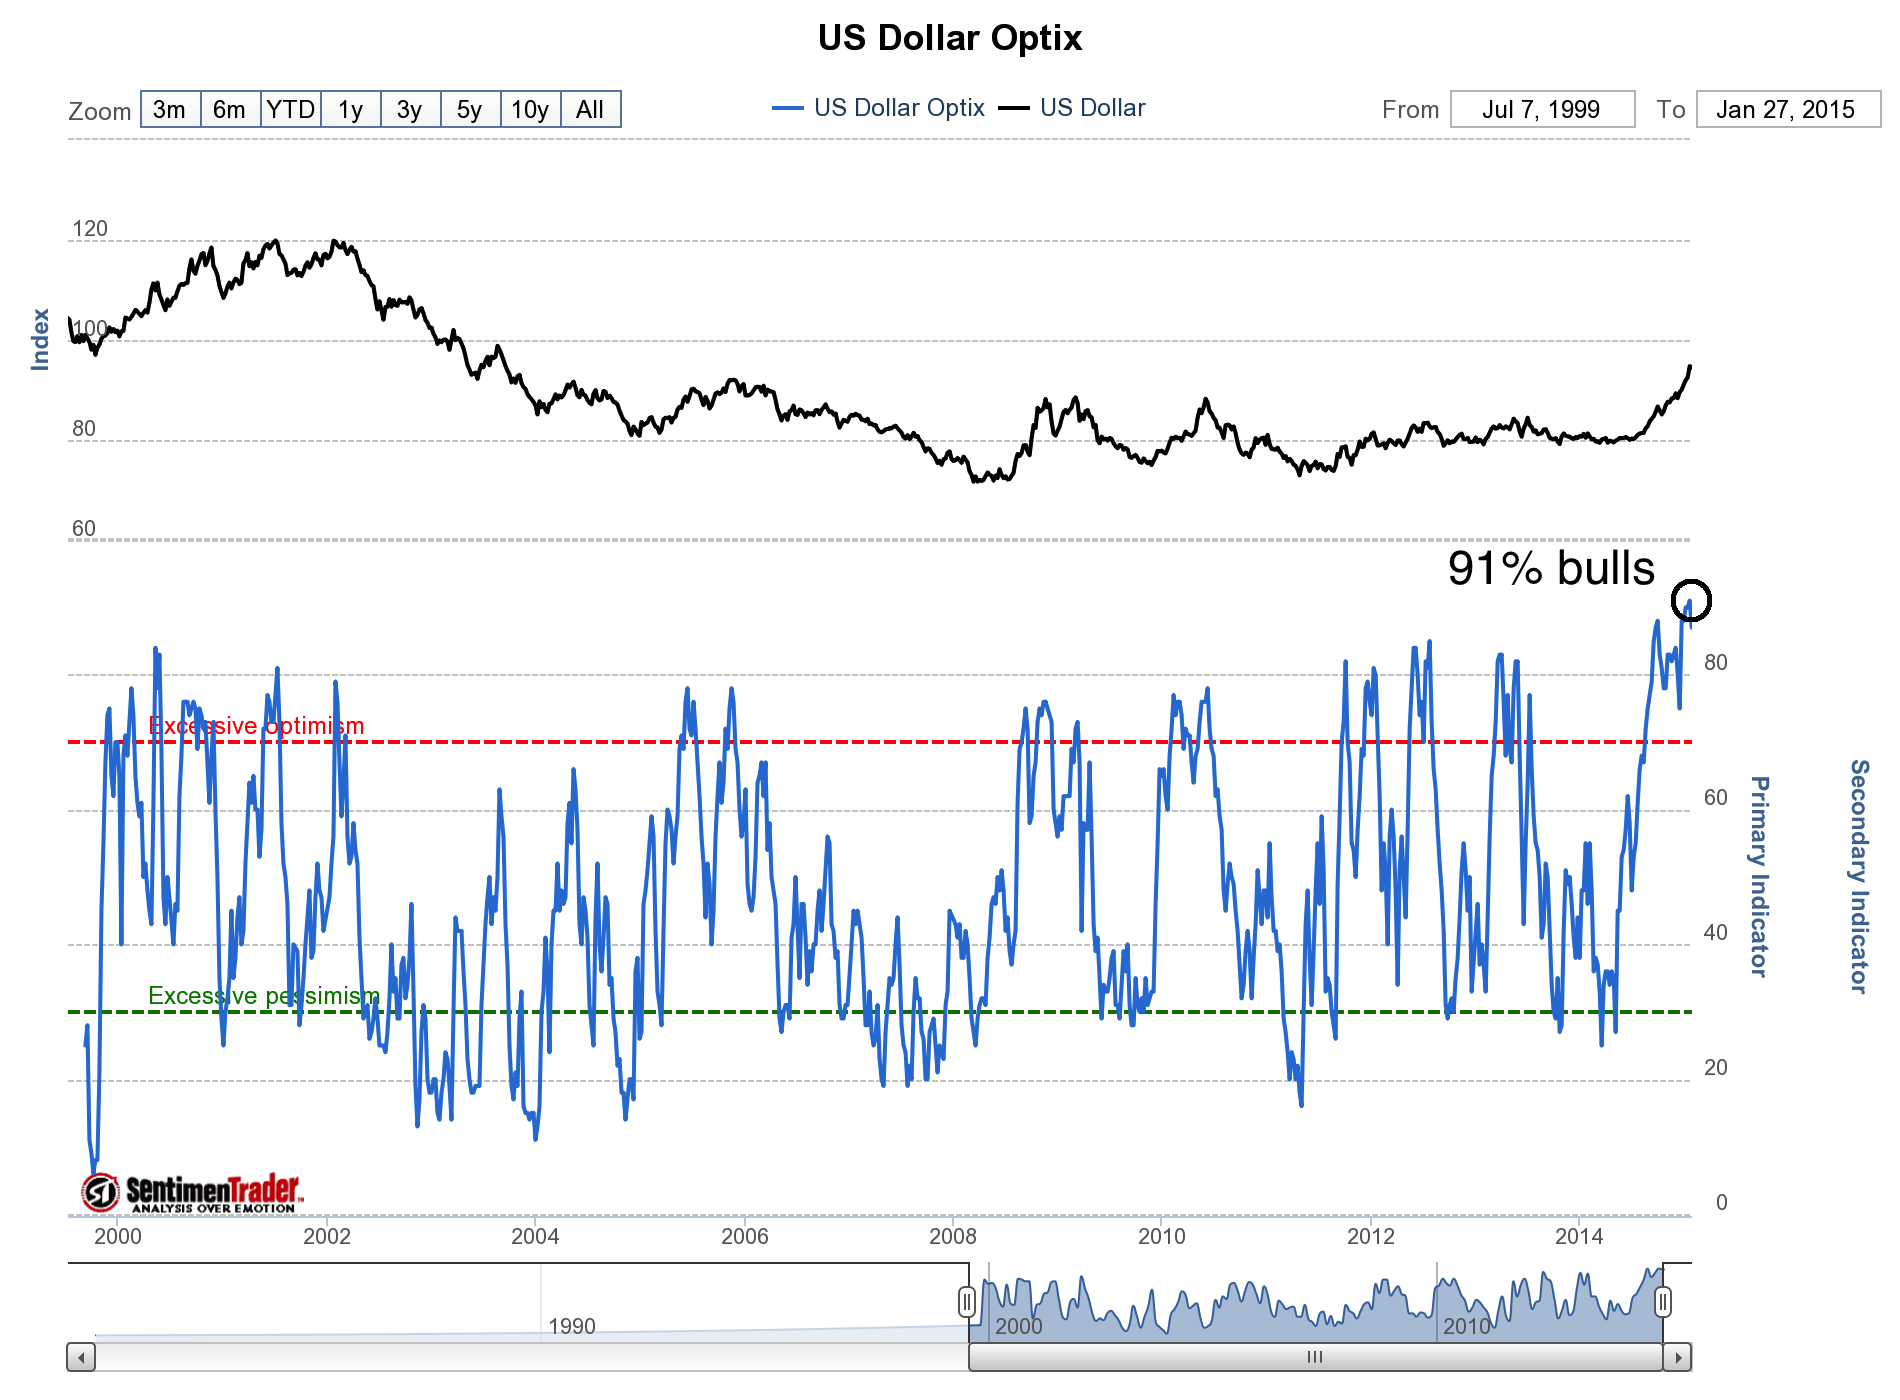
Meanwhile, sentiment on the US dollar has reached a major extreme. Public opinion charted below (from sentimentrader) recently hit 91% bulls. That is the highest in 15 years. We should also note that the daily sentiment index for the US dollar index hit 98% bulls a few weeks ago. That is the highest reading since May 2010. The US dollar peaked a month later.

US dollar Index Public Opinion
Gold has performed very well amid tremendous US dollar strength and could get a further boost if and when the US dollar weakens. The US dollar index is extremely overbought and sentiment is extremely bullish. At the least it figures to correct or consolidate for a while. That could be gold’s chance to begin its next leg higher and force the bears to capitulate. While recent correlations have been atypical, I find it hard to believe gold doesn’t perform well if the US dollar corrects. In the days and weeks ahead, the key support levels are GDX $20 and Gold $1240 to $1250.
