Where to invest in Asia if you had a time machine
A positive day of trade in Asia today driven by a bounce in oil prices and weakness in the US dollar. Volumes were very light in the Christmas period, particularly in the ASX and Hang Seng, while Japanese markets were closed.
The DXY dollar index looked to be finding some stability during the Asian session with currencies moves relatively muted, except for gains by the Taiwanese dollar and declines by the Malaysian ringgit.
New Zealand’s November trade balance came in slightly better-than-expected at NZD -779 million, although its twelve month total blew out to its largest number since April 2009. Although the release had little effect on the kiwi dollar, which was holding steady just below the US$0.6820 level during the Asian session.
China left the CNY midpoint marginally stronger for the third day in a row giving further credence to the argument that we may have seen an end to CNY depreciation at least until the possibility of the next Fed rate hike approaches in April.
Japan
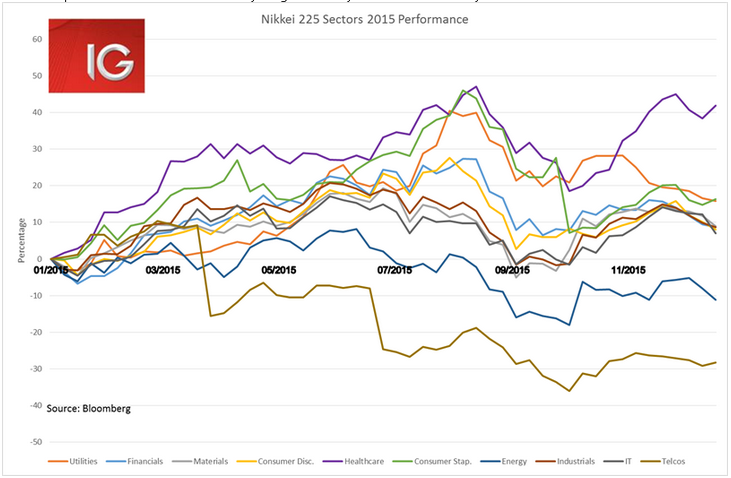
It has been a strong year for Japanese equities, returning 8.3% year-to-date (YTD). But when one dives into the index, it was clear that one really only wanted to have their money allocated to the Japanese healthcare sector. Despite the selloff in August, healthcare stocks in the Nikkei have still returned 40% year-to-date – a stellar performance by anyone’s measure – and significantly outperforming its closest competitors the utilities and consumer discretionary sectors. The worst performer by far was the telecommunications sector, which lost 28% year-to-date – even underperforming the energy sector in a year that saw oil prices drop to 11-year lows. Japanese government pressure to break up the oligopoly of NTT Docomo (N:DCM), KDDI (OTC:KDDIF) and Softbank (OTC:SFTBF), and lower phone and data fees have clearly weighed heavily on these stocks this year.

China
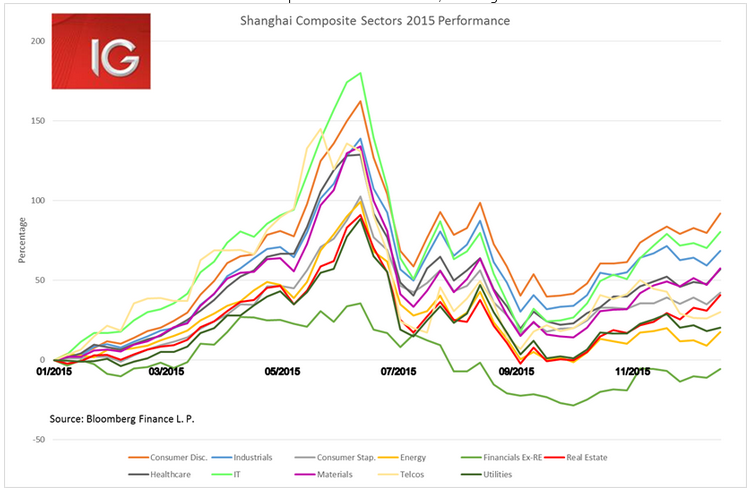
The Shanghai Composite caught the focus of the world this year as it gained 60% by its high in June. And even despite the dramatic selloff seen since June and through to August and September, the index has still managed to return 13% year-to-date. But it has very much been a story of allocation for success in the Mainland stock markets. Even after the dramatic June selloff, the transition in China’s economy from the ‘old’ industrial China to ‘new’ services- and consumption-focussed China is very evident in the returns. Elements of the ‘new’ China economy saw the best returns this year by far, with consumer discretionary stocks gaining 92% YTD, IT stocks returning 80.3%, and industrial stocks returning 68.4%. While growing non-performing loans from the ‘old’ China saw financials ex-real estate see the worst performance on the index, declining 5.5% YTD.

Hong Kong
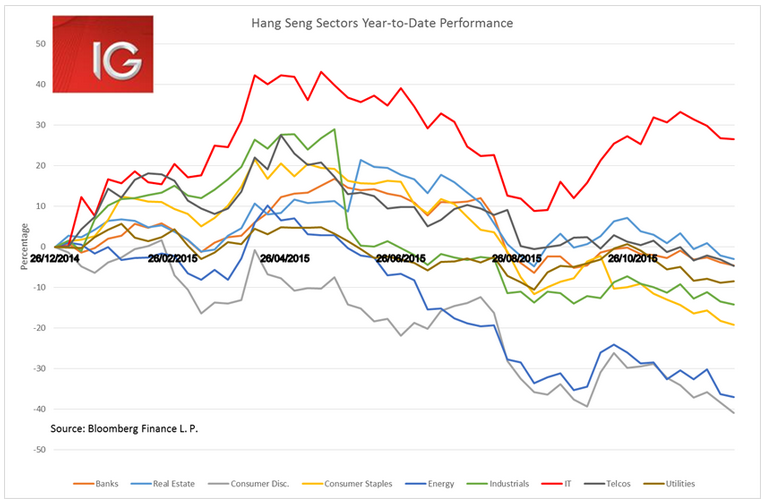
The Hang Seng will be keen to see the back of 2015 as it lost 6% YTD, seeing its worst annual performance since 2011. The only place one would have wanted to put their money was the IT sector, and that was entirely attributable to Tencent’s Hong Kong listing which returned 35% YTD. So basically, Tencent (OTC:TCTZF) was almost the only stock one would have wanted hold on the Hang Seng this year. On the bottom end, the energy sector unsurprisingly had a dismal year losing 37% YTD. But consumer discretionary stocks also lost 40% YTD, a sector dominated by gambling stocks and subject to the vicissitudes of the ongoing corruption crackdown and new capital outflow restrictions (Macau being a great place to wash RMB through as one spirits it away to invest in a different currency).

ASX
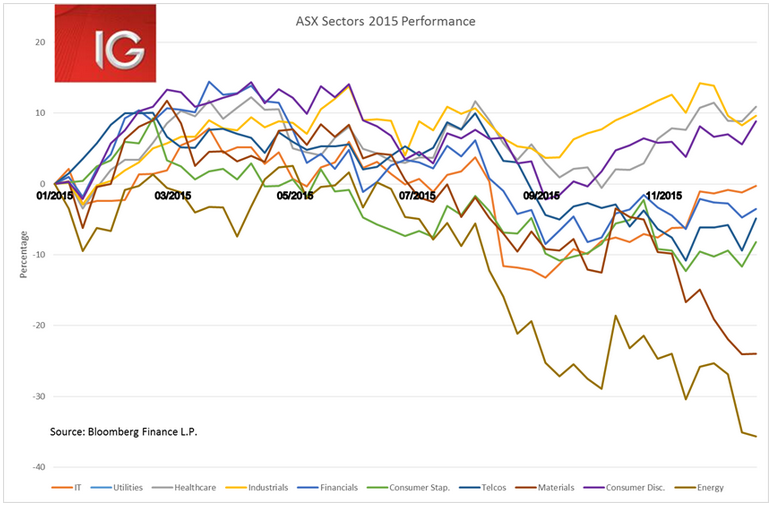
The ASX is down 4.9% this year, on track for its worst annual performance since 2011. But those who were invested exclusively in the healthcare, industrials and consumer discretionary sectors managed to weather out the storm. Healthcare has returned 11% YTD, industrials 10% and consumer discretionary 9% – a very respectable performances given the state of the rest of the index. In a year dominated by the commodities selloff, the ASX has been hit particularly hard. Unsurprisingly, the energy and materials sector were the worst performers, losing 36% and 24% YTD respectively. Corresponding to the selloff in materials and energy, there has been a dramatic reweighting of the index with the ASX more weighted to financials than ever before at 49% of market capitalisation. This means the fortunes of the index will be tied to the tribulations of the Big Four as they battle through a slowing housing market, growing bad and doubtful debts and new capital requirements. For those looking for a hedge to the performance of the banks in 2016, owning some stocks in the healthcare, industrials and consumer discretionary sectors may not be a bad idea.

Ahead of the European open we are calling the FTSE 6134 +51, DAX 10572 +83, CAC 4603 +35
