The dollar rallied on Friday, hitting its highest levels since early February, amid heightened expectations that the Federal Reserve will hike interest rates before the end of this year.
Growing expectations that Hillary Clinton will win the U.S. presidential election have also added to the view that a December rate hike is likely. The Fed’s next meeting is in November, but a rate hike ahead of the presidential election is seen as unlikely.
This week, investors will be looking ahead to Friday’s preliminary reading on U.S. third quarter growth, which is expected to show a significant rebound from the sluggish second quarter. The U.K. is also set to release its preliminary estimate of third quarter growth, due on Tuesday, the first such look at how the economy is preforming since the June 23 Brexit vote. Preliminary data on business activity in October for key euro zone members as well as for the wider euro area is due out Monday.
Today key euro zone members and the wider euro area are due to release flash PMIs for October, while in the U.S., New York Fed head William Dudley and St. Louis Fed chief James Bullard are to speak.
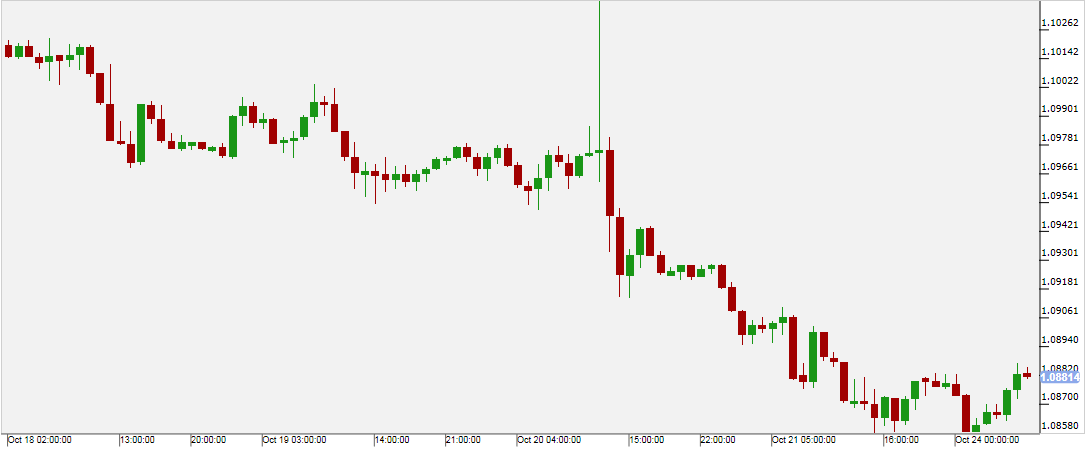
EUR/USDThe euro fell to seven-month lows against the dollar on Friday, with EUR/USD at 1.0882 in late trade.
The single currency remained under pressure in the wake of Thursday’s European Central Bank policy meeting and also after ECB President Mario Draghi’ speech, in which he indicated that the bank may extend its stimulus program in December.
Today investors will focus on flash PMIs for October, which will be released in the Eurozone, for further information on the strength of the European Economy.
 Pivot: 1.0915Support: 1.0855 1.083 1.08Resistance: 1.0915 1.095 1.0985Scenario 1: short positions below 1.0915 with targets at 1.0855 & 1.0830 in extension.Scenario 2: above 1.0915 look for further upside with 1.0950 & 1.0985 as targets.Comment: a break below 1.0855 would trigger a drop towards 1.0830.
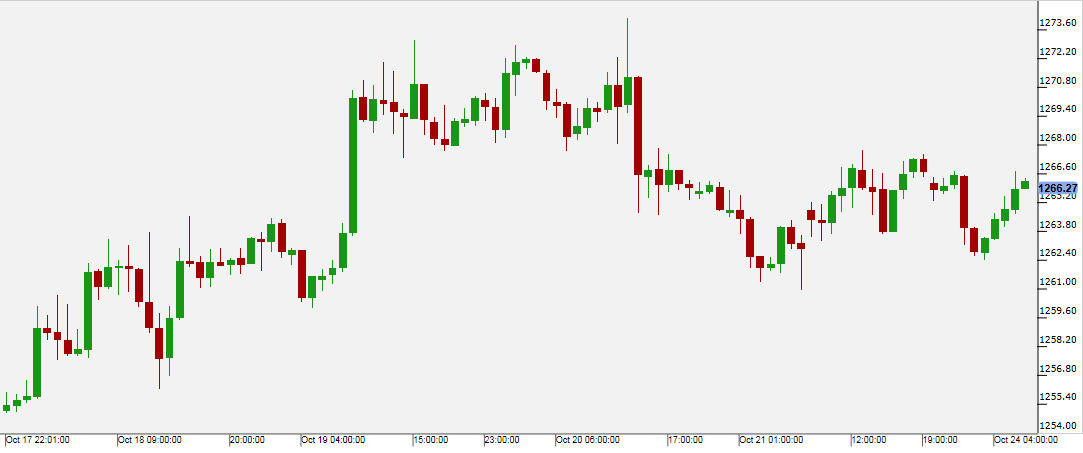
Gold prices fluctuated [i] between small gains and losses on Friday, before ending almost flat, as investors compared the effect of the stronger dollar and expectations for increased demand from India on the precious metal.
Investors currently price a 64% chance of a rate hike at the Fed's December meeting; according to federal funds futures tracked by the Fed Rate Monitor Tool.
Gold prices also continued to be underpinned by expectations of increased seasonal demand from India as the festival season, when buying gold is considered auspicious, gets underway at the end of the month.
 Pivot: 1261.5Support: 1261.5 1258 1256Resistance: 1268 1270.7 1274.5Scenario 1: long positions above 1261.50 with targets at 1268.00 & 1270.70 in extension.Scenario 2: below 1261.50 look for further downside with 1258.00 & 1256.00 as targets.Comment: a support base at 1261.50 has formed and has allowed for a temporary stabilisation.
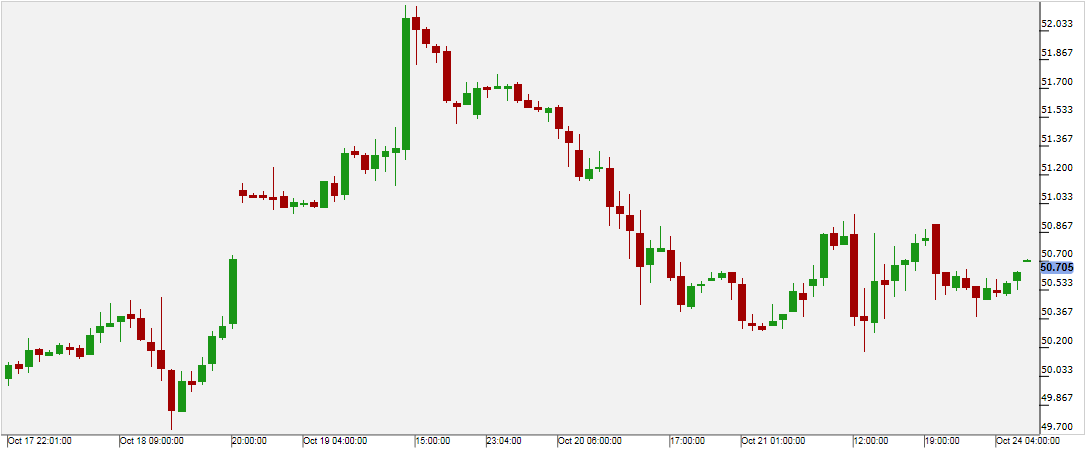
Oil futures reversed [i] early losses to end higher on Friday, despite a stronger dollar after Russia’s energy minister said an oil output freeze agreement was necessary to help stabilize the market.
Russian Energy Minister Alexander Novak on Friday expressed interest in cooperating with an OPEC production cut and said that he would make proposals to his Saudi Arabian counterpart at a meeting of Gulf Arab oil ministers over the weekend. The Organization of the Petroleum Exporting Countries announced late last month that it has a preliminary plan to limit production to a range of 32.5 million to 33.0 million barrels per day.
OPEC is expected to complete details of the proposed production cut at its next official meeting on November 30, but without Russia’s participation the plan could fail.
This week energy traders will focus on U.S. stockpile data on Tuesday and Wednesday for fresh supply-and-demand signals.
 Pivot: 51.05Support: 50.2 49.9 49.7Resistance: 51.05 51.53 51.83Scenario 1: short positions below 51.05 with targets at 50.20 & 49.90 in extension.Scenario 2: above 51.05 look for further upside with 51.53 & 51.83 as targets.Comment: technically the RSI is below its neutrality area at 50.
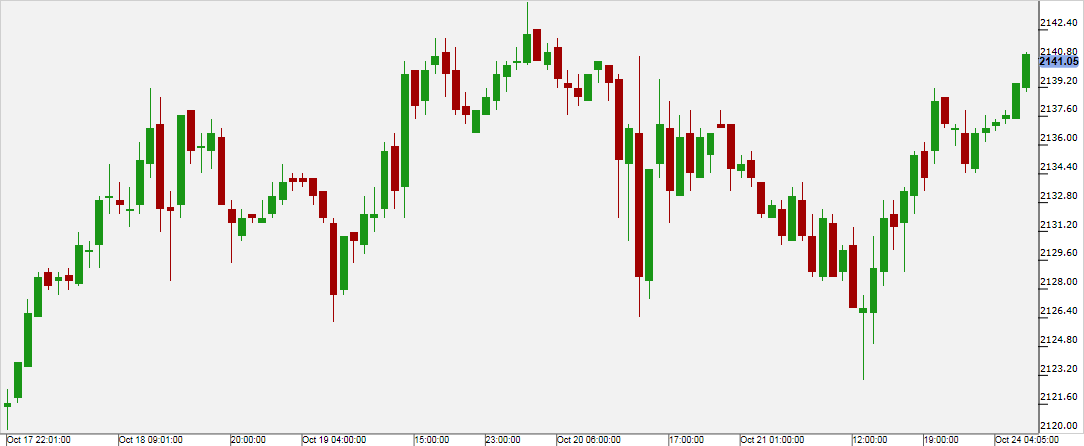
U.S. stocks were mixed after the close on Friday, as gains in the Consumer Services, Technology and Consumer Goods sectors led shares higher while losses in the Telecoms, Healthcare and Oil & Gas sectors led shares lower.
At the close in NYSE, the Dow Jones Industrial Average fell 0.09%, while the S&P 500 index declined 0.01%, and the NASDAQ Composite index added 0.30%.
This week, investors will be looking ahead to Friday’s preliminary reading on U.S. third quarter growth, which is expected to show a significant rebound from the sluggish second quarter.
 Pivot: 2123 Support: 2123 2118 2114 Resistance: 2144 2152 2157 Scenario 1: long positions above 2123.00 with targets at 2144.00 & 2152.00 in extension. Scenario 2: below 2123.00 look for further downside with 2118.00 & 2114.00 as targets. Comment: the RSI calls for a rebound.
