Last week light, sweet crude-oil futures for April delivery on the New York Mercantile Exchange settled 29 cents higher, at $93.13 a barrel. The contract fell 3.4%, the worst weekly performance for Nynex crude since Oct. 26, 2012. April ICE Brent crude oil, contract lost 3% in the week, the biggest decline since the week ended Dec. 7, 2012.

Stress on crude prices built when the EIA reported domestic crude-oil stocks rose by 4.1 million barrels last week, more than twice the expected level. Stocks are now sufficient to meet nearly 27 days of current low demand from refiners, EIA data show. That is the highest level of inventory cover since March 1994 and crude-oil stocks smack are at their highest level for this time of year on EIA data beginning in 1982. In my last article on crude oil on February 20, we said fresh recession trend below near main support 95.53. It did not break given support in the first three days of the week where it created 98 having some improvement from near $96.70 but it broke at given support of 95.53 at Thursday trade and it created below level 92.90 in intraday with selling pressure. We have also given target of $94 below level 95.53 who achieved easily in intraday.
* Crude Oil Technical Analysis (With Icchimoku Claud Indicator)

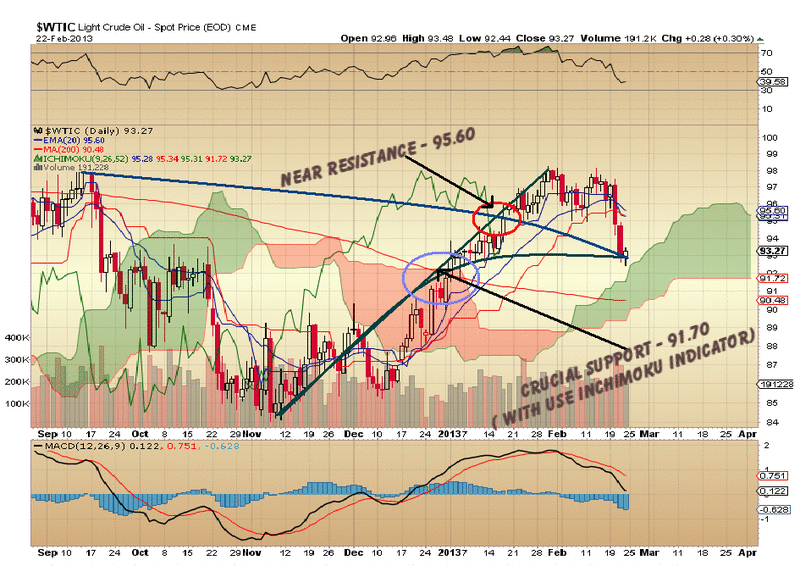
Last week crude oil closed below its crucial support 50 days SMA 93.77. WTI crude oil 13th April future contract creates on semiannual charts a format of symmetrical triangle in up trend it indicate that fresh boom trend will start just on crucial resistance 95.60. 95.60 is also 20 days EMA. If crude have not exceeded 95.60 next week may also start a new recession. You can see shortly above $96.44 and 97.53 to crossing and giving close on 95.60. Next Week If U.S crude oil lasting on near main support starting two days so you can see again definite level $96.44.
On semiannual chart I use with cloud and fibbo contexture finds that 91.70 will prove crucial support for the short term. You can see below 91.70 and 90.48 to breaking and giving close in 92.37. On semiannual chart RSI is near 39.58, its signal that some short covering may put crude oil above 94.16. If crude break its 200 days simple moving average 90.48 then next target can be 88.11 and 87 below.
--> Day Traders Should Follow The Levels Given Below:
-->Bullish Trend – 94.18 – 95.60 – 96.44 – 97.53
-->Bearish Trend – 92.37 – 91.70 – 90.48– 88.11

Stress on crude prices built when the EIA reported domestic crude-oil stocks rose by 4.1 million barrels last week, more than twice the expected level. Stocks are now sufficient to meet nearly 27 days of current low demand from refiners, EIA data show. That is the highest level of inventory cover since March 1994 and crude-oil stocks smack are at their highest level for this time of year on EIA data beginning in 1982. In my last article on crude oil on February 20, we said fresh recession trend below near main support 95.53. It did not break given support in the first three days of the week where it created 98 having some improvement from near $96.70 but it broke at given support of 95.53 at Thursday trade and it created below level 92.90 in intraday with selling pressure. We have also given target of $94 below level 95.53 who achieved easily in intraday.
* Crude Oil Technical Analysis (With Icchimoku Claud Indicator)

Last week crude oil closed below its crucial support 50 days SMA 93.77. WTI crude oil 13th April future contract creates on semiannual charts a format of symmetrical triangle in up trend it indicate that fresh boom trend will start just on crucial resistance 95.60. 95.60 is also 20 days EMA. If crude have not exceeded 95.60 next week may also start a new recession. You can see shortly above $96.44 and 97.53 to crossing and giving close on 95.60. Next Week If U.S crude oil lasting on near main support starting two days so you can see again definite level $96.44.
On semiannual chart I use with cloud and fibbo contexture finds that 91.70 will prove crucial support for the short term. You can see below 91.70 and 90.48 to breaking and giving close in 92.37. On semiannual chart RSI is near 39.58, its signal that some short covering may put crude oil above 94.16. If crude break its 200 days simple moving average 90.48 then next target can be 88.11 and 87 below.
--> Day Traders Should Follow The Levels Given Below:
-->Bullish Trend – 94.18 – 95.60 – 96.44 – 97.53
-->Bearish Trend – 92.37 – 91.70 – 90.48– 88.11
