Forex News and Events:
The key event of the day is FOMC Chair Yellen’s semi-annual testimony before the Senate. USD is broadly in demand versus its EM and G10 counterparts, except GBP. The inflation readings in UK greatly surprised on the upside; the CPI y/y hit 1.9% on year to June. The Cable fully recovered Monday losses against USD as the BoE hawks came back in charge. In the gold markets, the heavy squeeze sees support at $1,300 levels, the significant negative correlation with oil gives support to gold prices as oil futures ease on lower geopolitical risk premium. Moving forward, the USD-appetite will be key across the board: we will be closely monitoring how will the US retail sales data and Yellen’s testimony shape the US session, USD and gold.
UK inflation surprises on the upside
UK inflation greatly surprised on the upside in June, the CPI accelerated at the pace of 1.9% on year to June versus 1.6% expected and 1.5% a month ago. The producer and retail prices remained ranged, while the annual house prices inflation accelerated by 10.5% (most since May 2010). The inflation report unavoidably boosts the BoE hawks urging for policy normalization no later than the end of this year; the forward curve on SONIA steepens.
As knee-jerk reaction, GBP/USD jumped to 1.7146 – the mid-range of June-July uptrend channel. The sharp reversal should indicate the end of the downside correction attempt should the 21-dma (currently at 1.7081) hold. EUR/GBP aggressively sold-off to 0.79335, crossing below the two-week corrective channel base. Decent option related offers are waiting to be activated at 0.79000/300 zone for today expiry. The sharp move should build stronger resistance at 0.79730/806 (21-dma / intraday high) for the day.
The UK unemployment rate will be released on Wednesday, the three month average is seen at 6.5% (vs. 6.6% last).
Gold prices sustained by negative gold-oil correlation
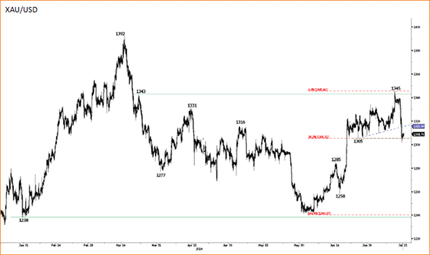
The week started with heavy gold unwind, XAU/USD aggressively sold-off to $1,303 yesterday, sending the trend indicators in the red zone. Technicals suggest the extension of weakness to $1,285/87.45 (June 16th high / Fib 50% on Jan-Mar rally) as long as the 21-dma-support (currently at $1,316) holds. At this stage, we remind that the direction is crowded. Yesterday’s unwind inevitably squeezed the technicals resulting in negative signals, while on the other hand generating opportunities for dip-buyers. The direction will perhaps be defined by the USD-leg today and tomorrow. The FOMC Chair Yellen’s semi-annual testimony before the Senate and House will be closely monitored across the board. We believe that Yellen will keep her cautious and dovish tone regarding the US recovery, thus keeping the USD soft broadly. In this scenario, the gold prices should benefit from loose USD for recovering Monday losses. If however Yellen surprises with unexpected hawkish stand, than we should expect the continuation of the gold unwind alongside with a broad-based USD pick-up.
Technically, the cross-asset analysis shows that the 10-week correlation between Brent crude and gold vanished from almost -50% to -5% on Friday, as declining geopolitical premium on oil hit the safe-haven demand in gold. The correlation bounced back to -36% as of today, suggesting that further improvement in the market sentiment should first give support to gold due to current negative correlation, but fundamentally because there is no reason for such a sharp reversal to risk-on (!) The correlation should then go back to positive territories once the panic is over.
In the oil market…
The Brent erases gains as the geopolitical premium on Iraqi situation declines. The fact that the Iraqi conflict didn’t spread to south, containing ¾ of country’s oil reserves, combined to the reopening of two oil-export stations in Libya eased tensions on the oil market. The Brent crude is heading towards $106, while WTI tests $100.00 in New York yesterday. The spread between Brent and WTI remains at about $5-6, versus $7-8 seen in June.

Today's Key Issues (time in GMT):
2014-07-15T12:30:00 USD Jul Empire Manufacturing, exp 17, last 19.282014-07-15T12:30:00 USD Jun Retail Sales Advance MoM, exp 0.60%, last 0.30%
2014-07-15T12:30:00 USD Jun Retail Sales Ex Auto MoM, exp 0.50%, last 0.10%
2014-07-15T12:30:00 USD Jun Retail Sales Ex Auto and Gas, exp 0.50%, last 0.00%
2014-07-15T12:30:00 USD Jun Retail Sales Control Group, exp 0.40%, last 0.00%
2014-07-15T12:30:00 USD Jun Import Price Index MoM, exp 0.40%, last 0.10%
2014-07-15T12:30:00 USD Jun Import Price Index YoY, exp 1.10%, last 0.40%
2014-07-15T13:00:00 CAD Jun Existing Home Sales MoM, last 5.90%
2014-07-15T14:00:00 USD May Business Inventories, exp 0.60%, last 0.60%
The Risk Today:
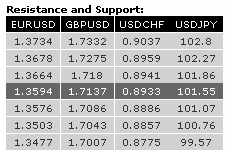
EUR/USD rose yesterday but failed to hold most of its gains at the end of the session. A bearish bias is favoured as long as prices remain below the resistance at 1.3664 (03/07/2014 high). Hourly supports stand at 1.3589 (10/07/2014 low) and 1.3576. An hourly resistance can be found at 1.3651 (10/07/2014 high, see also the 61.8% retracement). In the longer term, the break of the long-term rising wedge (see also the support at 1.3673) indicates a clear deterioration of the technical structure. A long-term downside risk at 1.3379 (implied by the double-top formation) is favoured as long as prices remain below the resistance at 1.3775. Key supports can be found at 1.3477 (03/02/2014 low) and 1.3296 (07/11/2013 low).
GBP/USD has broken the hourly support at 1.7086, opening the way for a deeper corrective phase. Another support stands at 1.7007 (27/06/2014 low). Hourly resistances can be found at 1.7144 (14/07/2014 high) and 1.7180 (04/07/2014 high). In the longer term, the break of the major resistance at 1.7043 (05/08/2009 high) calls for further strength. Resistances can be found at 1.7332 (see the 50% retracement of the 2008 decline) and 1.7447 (11/09/2008 low). A support lies at 1.6923 (18/06/2014 low).
USD/JPY is bouncing after having broken its recent low at 101.24 (30/06/2014 low). Monitor the resistance at 101.86 (09/07/2014 high, see also the 50% retracement). Hourly supports can be found at 101.45 (previous resistance) and 101.07. A long-term bullish bias is favoured as long as the key support 99.57 (19/11/2013 low) holds. However, a break to the upside out of the current consolidation phase between 100.76 (04/02/2014 low) and 103.02 is needed to resume the underlying bullish trend. A major resistance stands at 110.66 (15/08/2008 high).
USD/CHF has bounced near the hourly support area defined by 0.8896 (61.8% retracement) and 0.8886 (intraday low). Hourly resistances are given by the declining channel (around 0.8941) and 0.8959 (07/07/2014 high). From a longer term perspective, the bullish breakout of the key resistance at 0.8953 suggests the end of the large corrective phase that started in July 2012. The long-term upside potential implied by the double-bottom formation is 0.9207. A key resistance stands at 0.9156 (21/01/2014 high).oz.

