Forex News and Events:
Traders still adjust euro positions to the possibility of an ECB action at June meeting. EUR-crosses are broadly weaker, while some traders are already looking for dip-buying opportunities. What would be a good time to entry? Is it too early to consider re-building / strengthening of the EUR longs? In UK, the industrial and manufacturing production showed mixed performance in March, the trade deficit with non-EU countries took a hit perhaps due to strong GBP. The Cable sold-off aggressively, pulling the RSI at 62% from 74% on May 5th.
Draghi feels comfortable to act next month
The ECB kept rates on hold at yesterday’ policy meeting. The main refi rate remains stable at 0.25%, the deposit / marginal lending corridor at 0.00 / 0.75%. Indeed, the economic data since April meeting did not require an immediate action. Slight improvement in April CPI estimate (from 0.5% to 0.7%) and the improving PMI readings gave the ECB the flexibility to keep rates on hold in May.
The ECB will revise the inflation and growth forecasts at June meeting. A revision on the downside should build the right context to proceed with concrete policy action. However, we highlight that the “inflation expectations remain fairly anchored” according to Draghi and the Euro-zone CPI is expected to rise towards 2% target by end-2016. The downside risks to Euro-zone recovery include geopolitical tensions and the FX rates according to the ECB. Although Draghi said that the council is comfortable with acting the next time- thus triggering an aggressive EUR/USD unwind below the 21-dma - he did not say that the council will act the next time. In our view, EUR/USD should at least break 1.4000 for ECB to take a concrete step.
Technically, EUR/USD stands at the MACD pivot 1.3840, which also coincides with the 21-dma. The short-term reversal now needs confirmation. A daily close below the MACD zeroline should signal consolidation of post-Draghi weakness. The key support stands at 1.3800 (optionality) and 1.3775 (last week negative spike), stops are eyed below. If the bearish trend gains traction, EUR-longs should stay in the sidelines before starting to chase fresh opportunities.
EUR/GBP took an impressive dive post-Draghi. Option barriers below 0.81750 are now active. Trend and momentum indicators suggest the extension of weakness. The key support stands at 0.81577 (2014 low), our mid-term support remains unchanged at 0.80855 (January 2013 low).
EUR/CHF is better at the 50-dma (1.21848) area today, however the technicals are still marginally bearish. The soft inflation readings in April are clearly supportive of loose SNB policy, comfortably below its inflation target. In his speech in HEC Lausanne yesterday, the SNB Vice President Jean-Pierre Danthine stated that the softness in Swiss consumer prices are mainly due to strong Swiss franc. Indeed, official data confirms that safe-haven Swissy demand is reflected in form of significantly higher 1’000 franc banknote demand and the appetite is quite difficult to be totally control by the SNB. Especially at the stage where the official libor target stands at 0.00% - 0.25% - the minimum policy rate that can be targeted.
Over the past weeks, the geopolitical tensions kept the upside pressures high in Swiss franc demand. The Draghi-triggered EUR/USD hike sent USD/CHF to 0.8703 (a stone’s throw higher than the previous low of 0.8699). At this stage, the easing tensions in Ukraine temper the immediate safe-haven demand in Swiss francs. In USD/CHF chart, we see a short-term trend reversal suggesting improved interest for a daily close above 21-dma (0.8806), while keeping in mind that renewed tensions are still an upside risk in CHF.

Today's Key Issues (time in GMT):
2014-05-09T12:30:00 CAD Apr Unemployment Rate, exp 6.90%, last 6.90%2014-05-09T12:30:00 CAD Apr Net Change in Employment, exp 13.5K, last 42.9K
2014-05-09T12:30:00 CAD Apr Full Time Employment Change, last 12.8
2014-05-09T12:30:00 CAD Apr Part Time Employment Change, last 30.1
2014-05-09T12:30:00 CAD Apr Participation Rate, exp 66.3, last 66.2
2014-05-09T14:00:00 GBP Apr NIESR GDP Estimate, last 0.90%
2014-05-09T14:00:00 USD Mar JOLTs Job Openings, exp 4125, last 4173
2014-05-09T14:00:00 USD Mar Wholesale Inventories MoM, exp 0.50%, last 0.50%
2014-05-09T14:00:00 USD Mar Wholesale Trade Sales MoM, exp 1.10%, last 0.70%
The Risk Today:
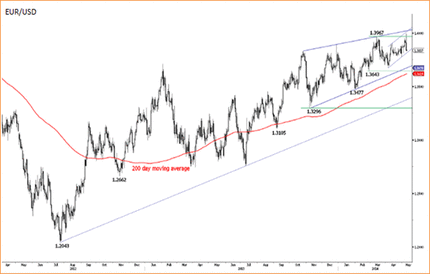
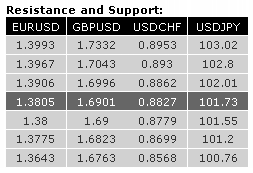
EUR/USD made a sharp bearish intraday reversal near the key resistance at 1.3967 yesterday. The support at 1.3865 (05/05/2014 low) has been broken, negating the short-term bullish momentum. A further decline towards the support at 1.3780 (09/04/2014 low) is likely. An initial support lies at 1.3812 (02/05/2014 low). A resistance stands at 1.3906 (11/04/2014 high). In the longer term, EUR/USD is still in a succession of higher highs and higher lows. However, the recent marginal new highs (suggesting a potential long-term rising wedge) indicate an exhausted rise. Furthermore, the successful test of the resistance at 1.3967 coupled with general overbought conditions favour a phase of weakness. A key support stands at 1.3643 (27/02/2014 low).
GBP/USD is fading near the major resistance at 1.7043. The hourly support at 1.6920 (01/05/2014 high) is challenged. Another support lies at 1.6823 (02/05/2014 low). In the longer term, prices continue to move in a rising channel. As a result, a bullish bias remains favoured as long as the support at 1.6661 (15/04/2014 low) holds. However, we are reluctant to suggest an upside potential higher than the major resistance at 1.7043 (05/08/2009 high), especially given the general overbought conditions. Another resistance can be found at 1.7332 (50% retracement of the 2007-2009 decline).
USDJPY USD/JPY has recently drifted lower. However, prices are now close to a key support area between 101.20 (03/03/2014 low) and 100.76 (see also the 200 day moving average and the rising channel). An hourly resistance stands at 102.01 (06/05/2014 high). Another resistance lies at 103.02. A long-term bullish bias is favoured as long as the key support 99.57 (19/11/2013 low) holds. Monitor the support area provided by the 200 day moving average (around 101.09) and the rising trendline from the 93.79 low (13/06/2013). A major resistance stands at 110.66 (15/08/2008 high).
USD/CHF bounced sharply near the key support at 0.8699 yesterday. A short-term rebound is likely. The resistance implied by the short-term declining trendline is challenged. Another resistance stands at 0.8862. Hourly supports can be found at 0.8779 (intraday low) and 0.8766 (intraday high). From a longer term perspective, the structure present since 0.9972 (24/07/2012) is seen as a large corrective phase. However, a decisive break of the key resistance at 0.8930/0.8953 is needed to validate a bullish reversal pattern.

