After stabilizing above the $500 level, will the upward trend continue? Yesterday saw a gain in the Bitcoin (BTC-eUSD) rate, hitting highs of $516 and today the upward trend has continued. Currently, the BTC-USD rate is $520.99, breaking through yesterday’s resistance of $514.35.
A recent report by Citi finds that the Bitcoin price is being subdued by miners and merchants. They stated that if miners provide a steady increase in the supply without an increase in final demand, with miners selling bitcoin to recoup their investment in mining equipment, downward pressure is put on prices. They also note that large merchants, such as Dell, who accept Bitcoin, are immediately selling and converting to fiat money, putting further downward pressures on the BTC-USD rate.
NewEgg, an online retail company, have recently announced they will expand bitcoin payments from the US to Canada, the second such company to do so. Previously TigerDirect added bitcoin payments to its website in July. NewEgg also operates in Taiwan and China, but these outlets have not started to accept Bitcoin yet, but are potential future developments.
One of Europe’s biggest banks, Santander, is commissioning a study of the impact of Bitcoin on banking markets. Previously, other banks have done similar reports, with National Australia Bank stating that Bitcoin would take several years to gain mainstream acceptance last year. This report is due to be finalised in late September and will consolidate a large amount of information that will guide strategy for the bank.
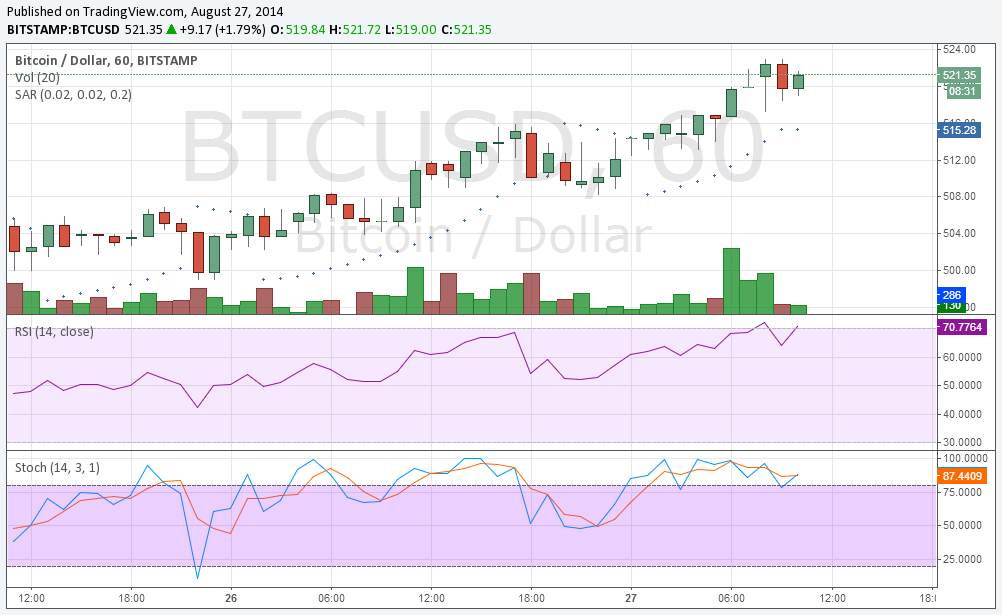
Looking at the hourly chart below, we see that the parabolic stop and reversal indicates the upward trend has not ended yet and any buy orders should not be exited yet. The market saw large buying volumes early this morning. Both the stochastic and relative strength index are both indicating that the market is entering overbought conditions, which imply a downward price movement as the market corrects itself.

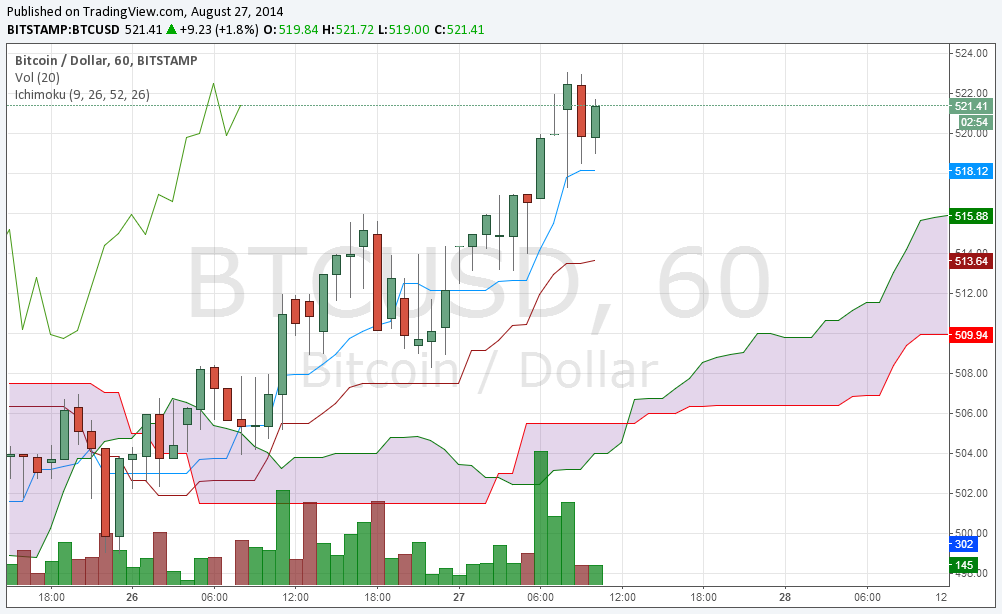
Looking at the Ichimoku Kinko Hyo for the hourly chart, we see that the price action is above the cloud, indicating a bullish trend. If the price passes below the base line at $513.64, this will indicate bearish momentum and we could see further declines if this materialises. The cloud will act as support for the next 24 hours or so, providing support at the $506-$509 level today and at the $507-$514 level tomorrow. The cloud has also changed from a red to a green cloud, which indicates a bullish trend.

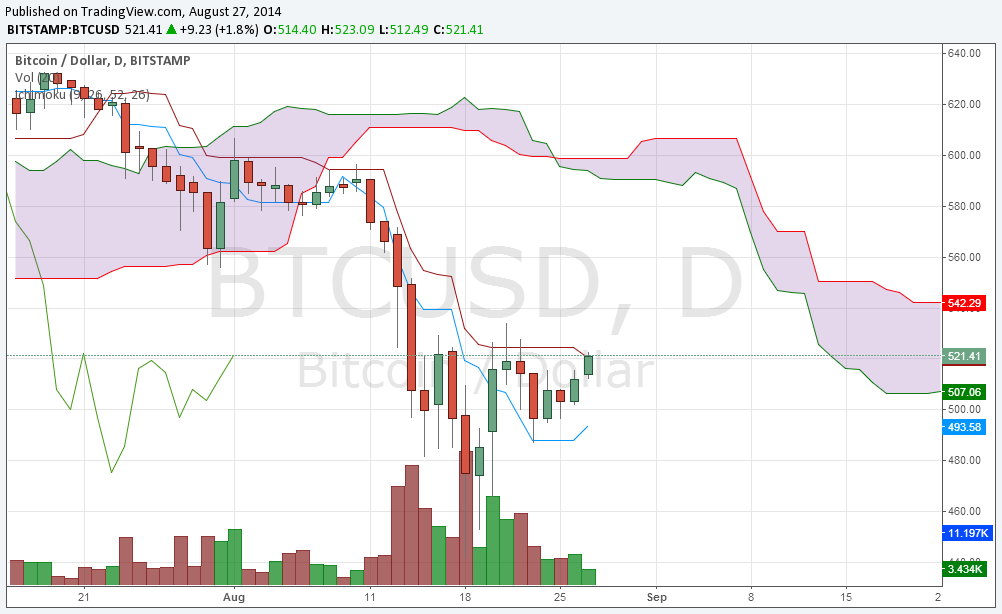
Looking at the daily chart with the same indicator, we see that the price action is below the cloud, indicating a bearish trend overall. If the price closes above $520.54, this signals bullish momentum, as the price will have crossed and closed above the base line. The $590-$605 level will act as resistance for the remainder of August, but the cloud declines for September, indicating resistance levels will be lower in the next few weeks.

The important resistance levels for today are at $529.86 and $551.61, whereas the important support levels are at $494.28 and $459.47.
Trade BTC/USD and over 125 other assets at YesOption – The leading forex and binary options trading platform - offering returns up to 89% every trade.
