After bouncing from yesterday’s low to the $397 level, the BTC/USD price has resumed the downward movement, currently trading at $381.07 on the BitStamp exchange. The price is currently approaching the first daily support at $376.01. The price is more likely to bounce upwards from this level and tend towards the daily pivot point. However, if the price continues to trend downwards after breaching this support level, the next support level lies at $360.93.
Robocoin launched their own Bitcoin wallet yesterday, known as the Robocoin wallet. It aims to provide banking services for those with no access to traditional banking methods and the unique selling point of this wallet it that it allows users to instantly convert Bitcoin to cash at Robocoin ATM locations around the world. Also, on security, the wallet provides security features so that users do not need to protect their private keys or navigate complex addresses.
Coinapult, a Panama-based Bitcoin wallet provider, has raised around $775,000 in funding which it intends to use for marketing and product development. Coinapult has also introduced a bitcoin price volatility solution known as LOCKS, which allows users to peg the value of Bitcoin to gold, the US dollar or any other asset, locking the value of their Bitcoins, protecting users from large fluctuations that are characteristic of the Bitcoin market.
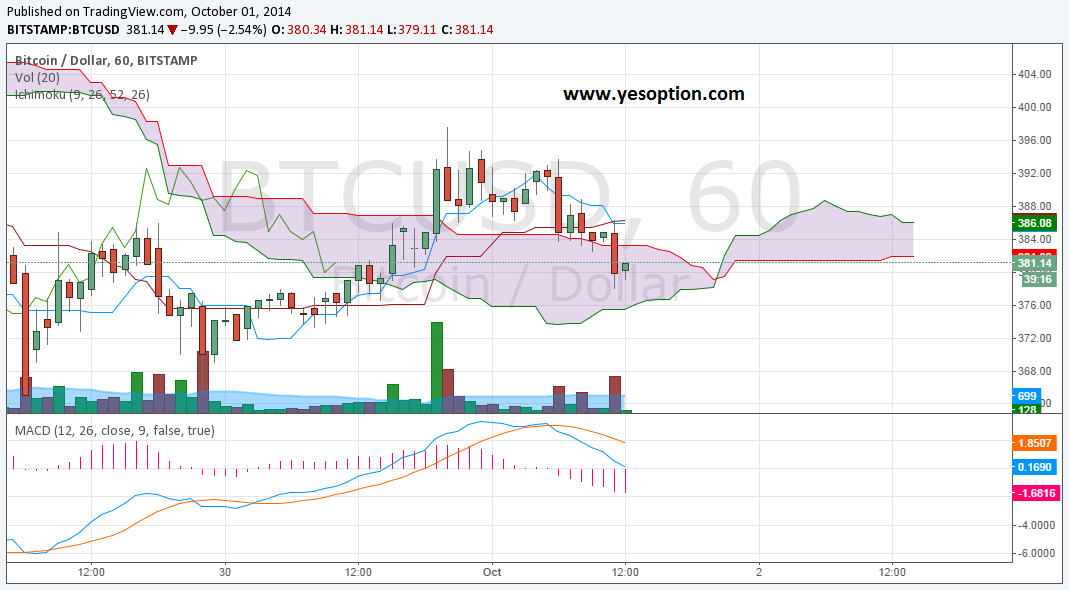
The chart below shows the hourly price action on the BitStamp exchange. The price action broke above the Ichimoku cloud briefly yesterday, but large selling volumes brought the price below the base line, indicating bearish momentum. The base line also looks set to move above the conversion line, also indicating bearish momentum. If the price moves below the cloud, this will be taken as confirmation of a downward trend forming. Alternatively, the price may bounce of the lower support of the Ichimoku cloud and start to trend upwards again. The MACD indicates that the market conditions are oversold, as the faster moving average is getting further away from the slower moving average. Also, the MACD should make an upward cross later today, which signals the start of a new upward trend.

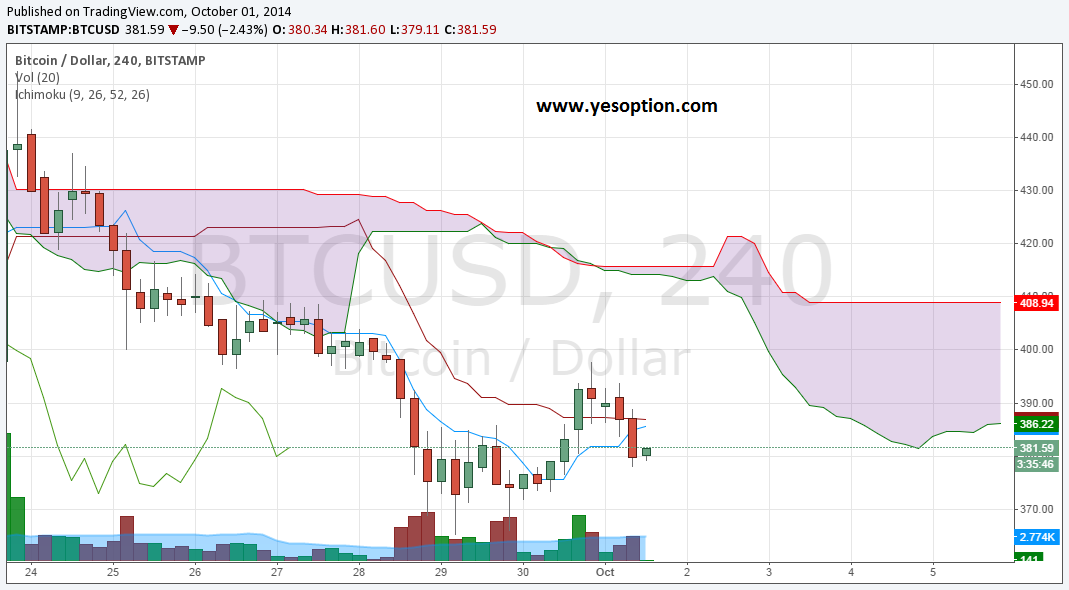
The 4-hour chart is shown below, which shows that the price is currently tending towards the base line. If the price breaks above the base line at $386.93, this will be confirmation of bullish momentum, which will be strengthened if the conversion line moves above the base line, which looks to be imminent from the chart below. This should send the price higher towards the first resistance provided by the Ichimoku cloud at the $413 level. However, since the price action is below the Ichimoku cloud, we could see a slight upward bounce before a continuation of the current trend.

