Falling, falling, falling
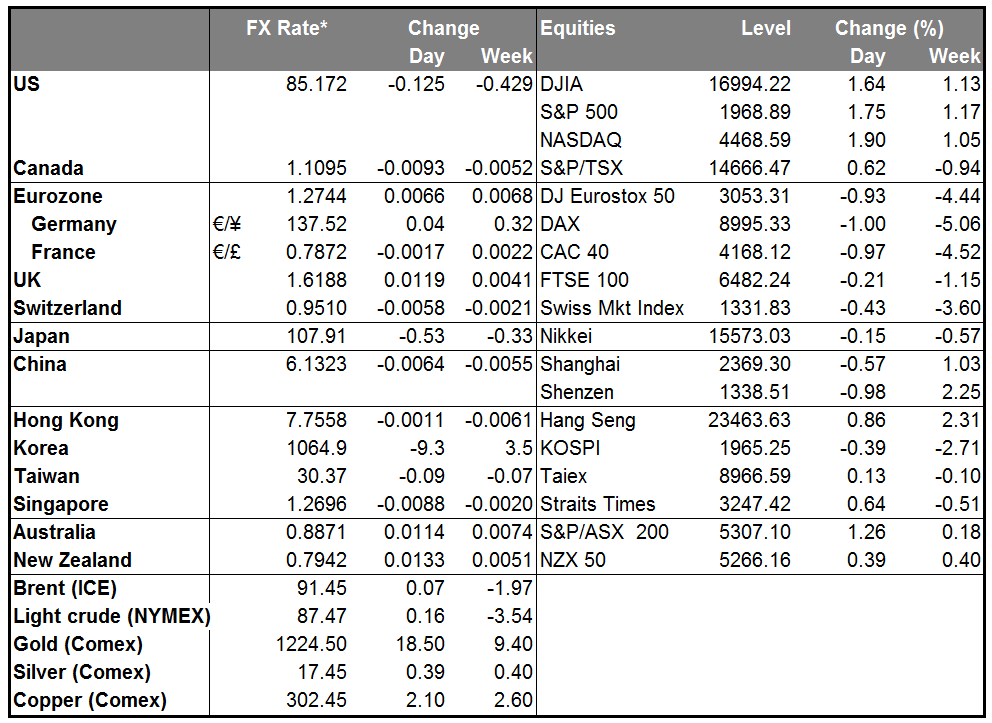
Yet another down day for the dollar, with some quite serious drops – over 1% vs AUD and 1.8% vs NZD. Remember the days when we were complaining about a lack of volatility?
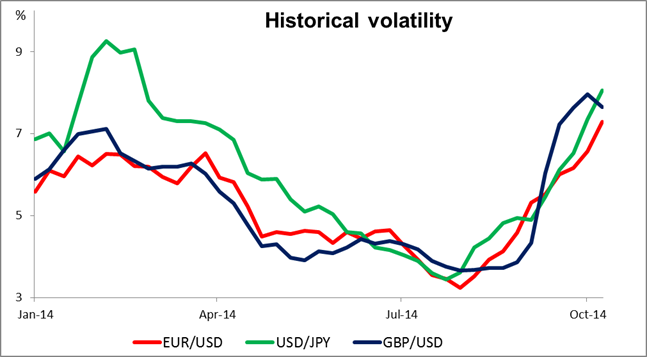
In fact USD was firming until the FOMC minutes came out. They were unexpectedly dovish. Committee members noted a number of risks to the outlook, ranging from stalled growth in the Eurozone to trouble in the Middle East or Ukraine to the slow recovery in housing construction. Many members still believe that there is significant underutilization of labor resources, the key point that they will focus on in determining when to raise rates. The minutes suggest that the FOMC members are in no hurry to raise rates, which is in marked contrast to the rise in their estimates for the Fed funds rate (the “dot plot”). As a result, Fed funds rate expectations for 2017 collapsed a further 12 bps on top of Monday’s 8 bps and the dollar came crashing down with them.
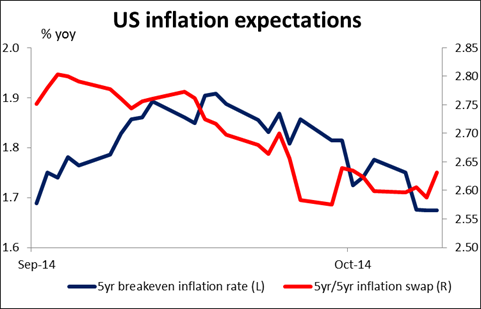
In fact, inflation expectations have come down notably even since the FOMC meeting! The five-year breakeven inflation rate has fallen by around 22 bps to 1.68%, while the 5yr/5yr inflation swap so beloved of Mr. Draghi has fallen by 9 bps.
Notably for us, there was considerable comment about the dollar. Some participants worried that further appreciation of the dollar could “have adverse effects on the US external sector.” “A couple of participants” also pointed out that a stronger dollar might exert downward pressure on inflation, making it harder for the Fed to reach its inflation target. These worries about the strength of the dollar were in marked contrast to yesterday’s sanguine comments by US Treasury Secretary Jack Lew, who said that “the strong dollar is good for the United States.” The Treasury, not the Fed, has control over the dollar so the FOMC’s comments do not imply any intervention to get the dollar’s value down. They do have a bearing on US monetary policy, however. There is a measure of “reflexivity,” insofar as the FOMC is influenced by the dollar and the dollar is influenced by the FOMC.
In short, the FOMC minutes changed the outlook for US rates. Unfortunately there is no press conference after the October FOMC meeting, so we will not get any clarification of this conundrum any time soon – just drips and drabs from individual FOMC members. That means we are probably in for a period of greater volatility. We could also see further profit-taking in USD as investors scale back their expectations for tightening. Nonetheless I still see the US economy outperforming other economies and the US moving to a tighter monetary policy before most of its other counterparts, which should support USD.
Today’s indicators: During the European day, German trade balance is coming out and the forecast is for the surplus to decline a bit, adding to the recent weak data coming from the country.
In the UK, the Bank of England Monetary Policy Committee meets to decide on its key policy rate. The Bank is highly unlikely to change policy and therefore the impact on the market should be minimal, as usual. The minutes of the meeting though should make interesting reading when they are released on 22nd of October, especially after the continued deterioration of the UK economy.
In the US, initial jobless claims for the week ended Oct.4 are coming out.
The highlight of the day will be ECB President Mario Draghi and Fed Reserve Board Vice Chairman Stanley Fischer’s conversation on the latest developments in Europe and in global central banking. We could get some clarification about the widening divergence between the monetary policy outlooks of the two Banks. Fischer could also shed some light on the FOMC’s thinking. He is a relatively dovish person – both Reuters (NYSE:TRI)and Deutsche Bank (NYSE:DB) rate him 2 on a scale of 1 to 5. Thus his comments could add to the USD-negative tone of the market.
Besides those two, we have four more speakers on Thursday’s agenda. Riksbank Governor Stefan Ingves and ECB Governing Council member Ewald Nowotny speak during European time. During the US session, we have Richmond Fed President Jeffrey Lacker and San Francisco Fed President John Williams.
The Market
EUR/USD higher after the FOMC minutes
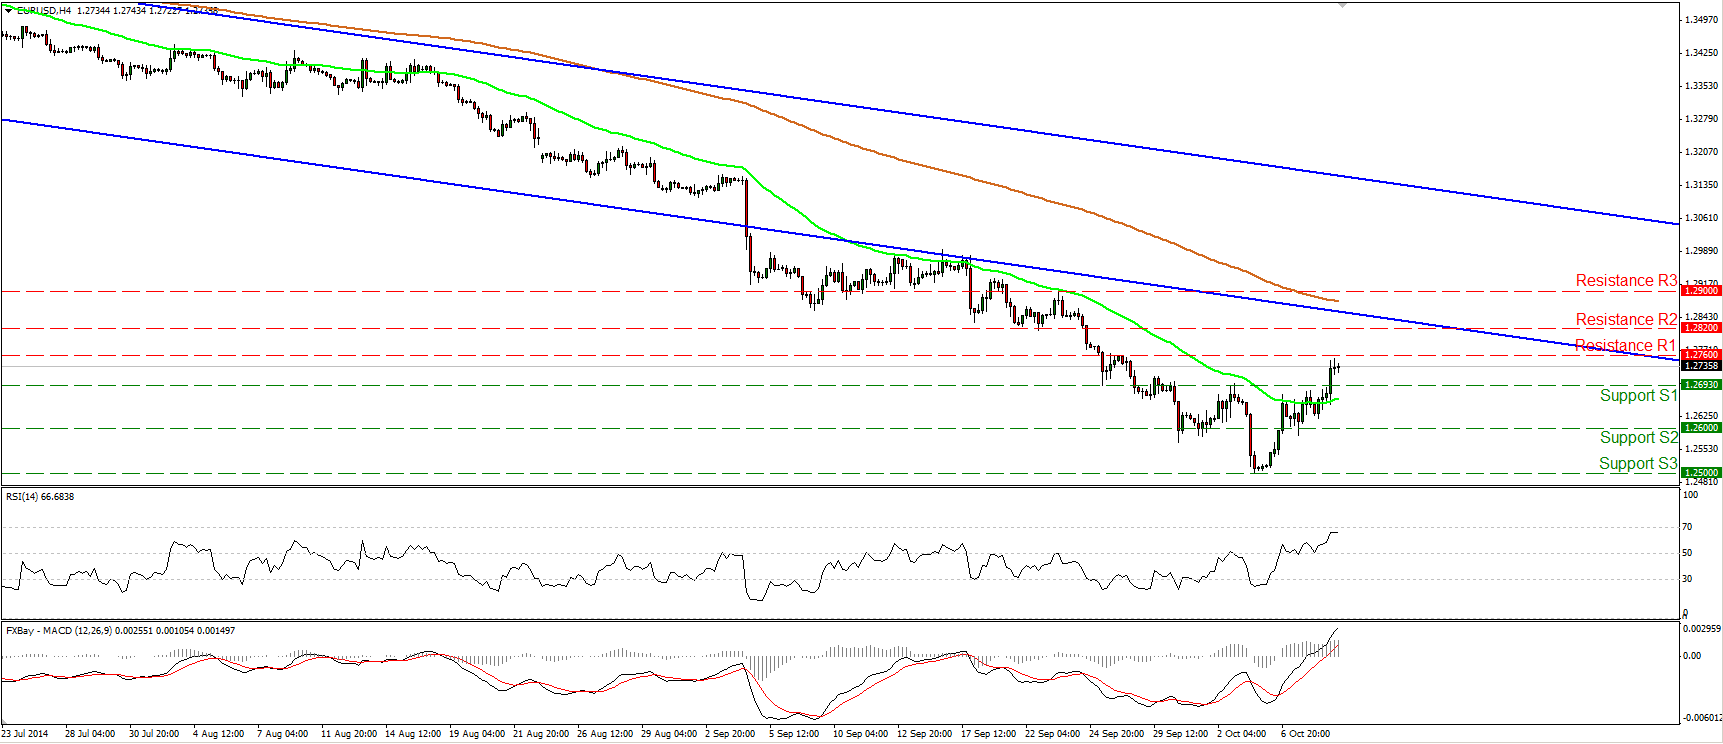
EUR/USD traded higher yesterday after the minutes of the latest FOMC meeting showed that Fed officials are worried that slowing global growth and a stronger dollar pose risks to the US economy. The pair rallied and moved above the resistance turned into support hurdle of 1.2693 (S1), completing a near-term inverted head and shoulders formation. This shifts the near-term picture of EUR/USD to positive, in my view. A clear move above 1.2760 (R1) could trigger further extensions and could target our next resistance at 1.2820 (R2). On the daily chart, our momentum studies support the notion. The 14-day RSI exited its oversold field and is now getting closer to its 50 line, while the daily MACD moved above its trigger. However, the broader trend remains to the downside since the price structure remains lower peaks and lower troughs below the 50- and the 200-day moving averages. As a result I will treat this week’s up wave as a corrective phase for now.
• Support: 1.2693 (S1), 1.2600 (S2), 1.2500 (S3)
• Resistance: 1.2760 (R1), 1.2820 (R2), 1.2900 (R3)
USD/JPY moves below 108.00
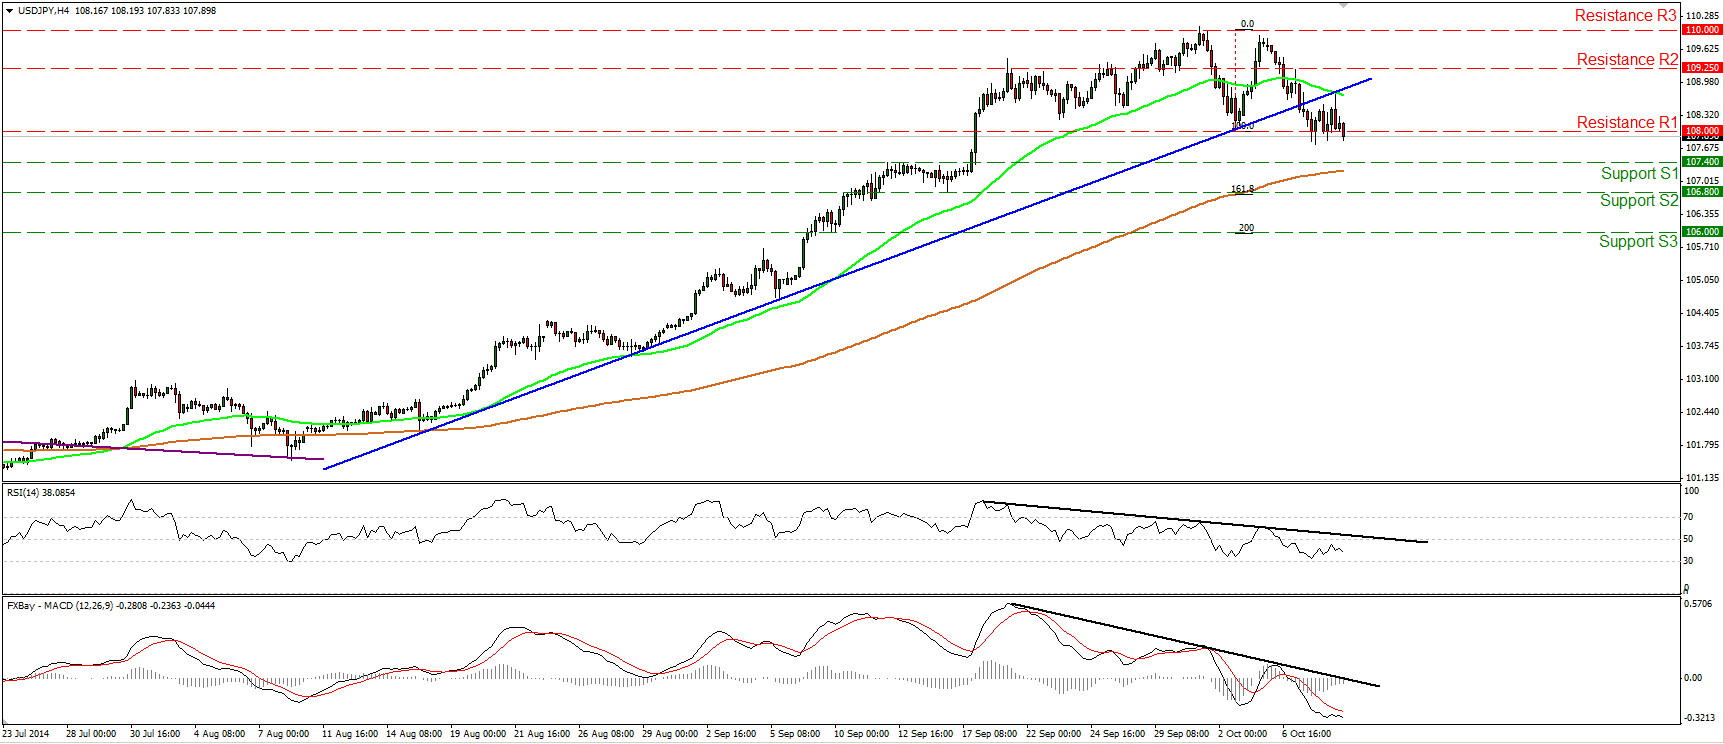
USD/JPY moved lower yesterday after consolidating slightly below the prior short-term uptrend line. The pair dipped below the 108.00 line, completing a possible double top formation and confirming the negative divergence between the price action and both our near-term momentum indicators. I would expect the bears to see as a first target the support line of 106.80 (S2), which happens to be the 161.8% extension level of the double top’s width. On the weekly chart, last week’s candle looks like a hanging man and alongside that the 14-week RSI dipped below its 70 line and is pointing down. The combination of these two signs increases the possibilities for the beginning of a downside corrective phase.
• Support: 107.40 (S1), 106.80 (S2), 106.00 (S3)
• Resistance: 108.00 (R1), 109.25 (R2), 110.00 (R3)
NZD/USD completes a double bottom
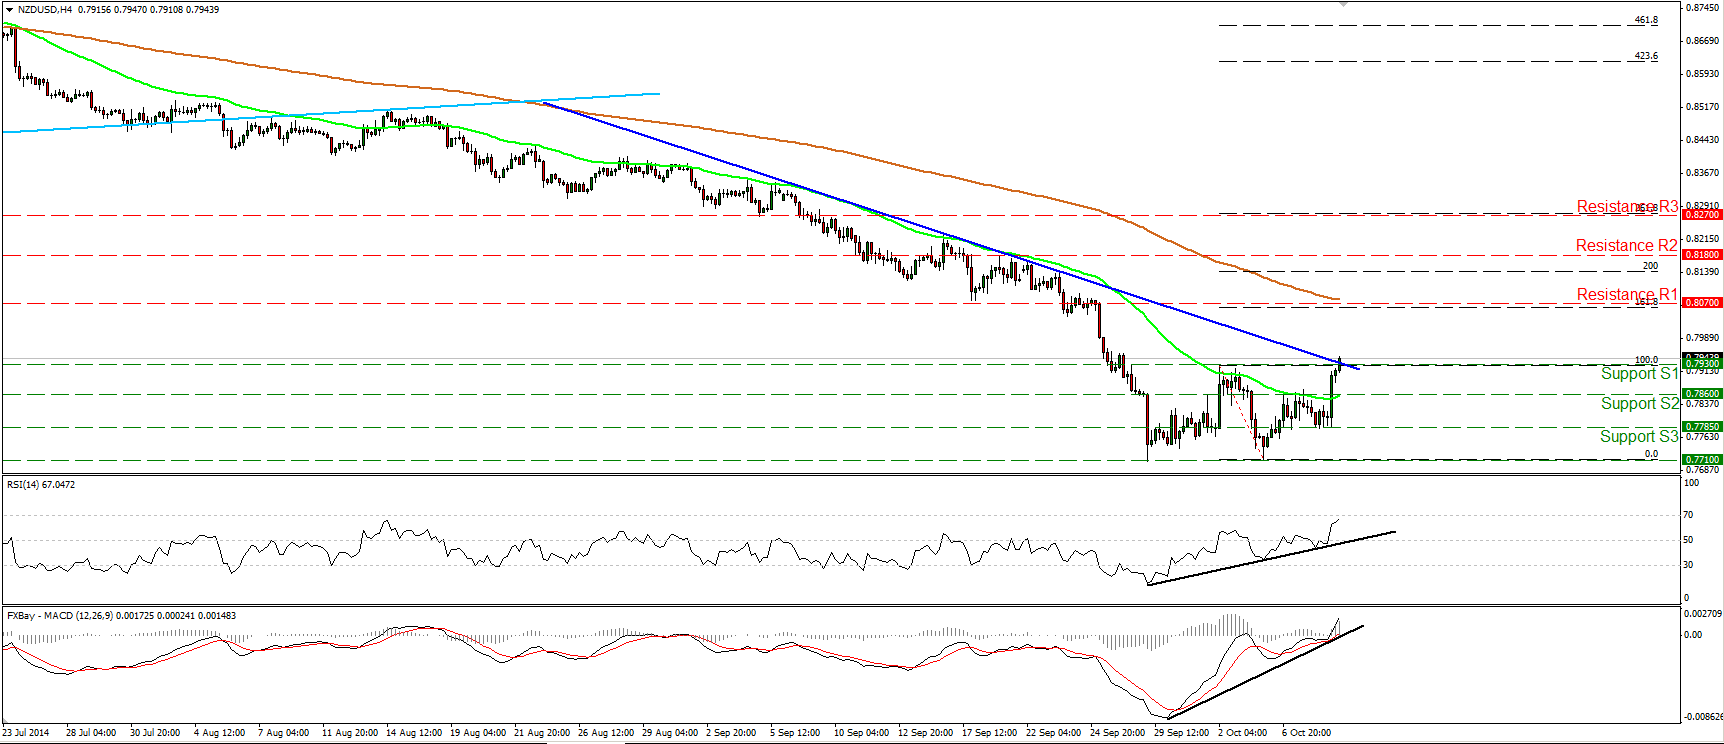
NZD/USD accelerated higher, breaking above the blue short-term downtrend line and violating the resistance (turned into support) barrier of 0.7930. Yesterday’s move confirmed the positive divergence between the price action and our momentum studies and signaled the completion of a possible double-bottom pattern on the 4-hour chart. On the daily chart, the 14-day RSI moved higher after exiting its oversold territory, while the MACD has bottomed and moved above its signal line, confirming the recent bullish momentum. This magnifies the case for the continuation of the upside corrective move, perhaps towards the 0.8070 (R1) line, which lies near the 161.8% extension level of the width of the double bottom pattern.
• Support: 0.7930 (S1), 0.7860 (S2), 0.7785 (S3)
• Resistance: 0.8070 (R1), 0.8180 (R2), 0.8270 (R3)
Gold even higher
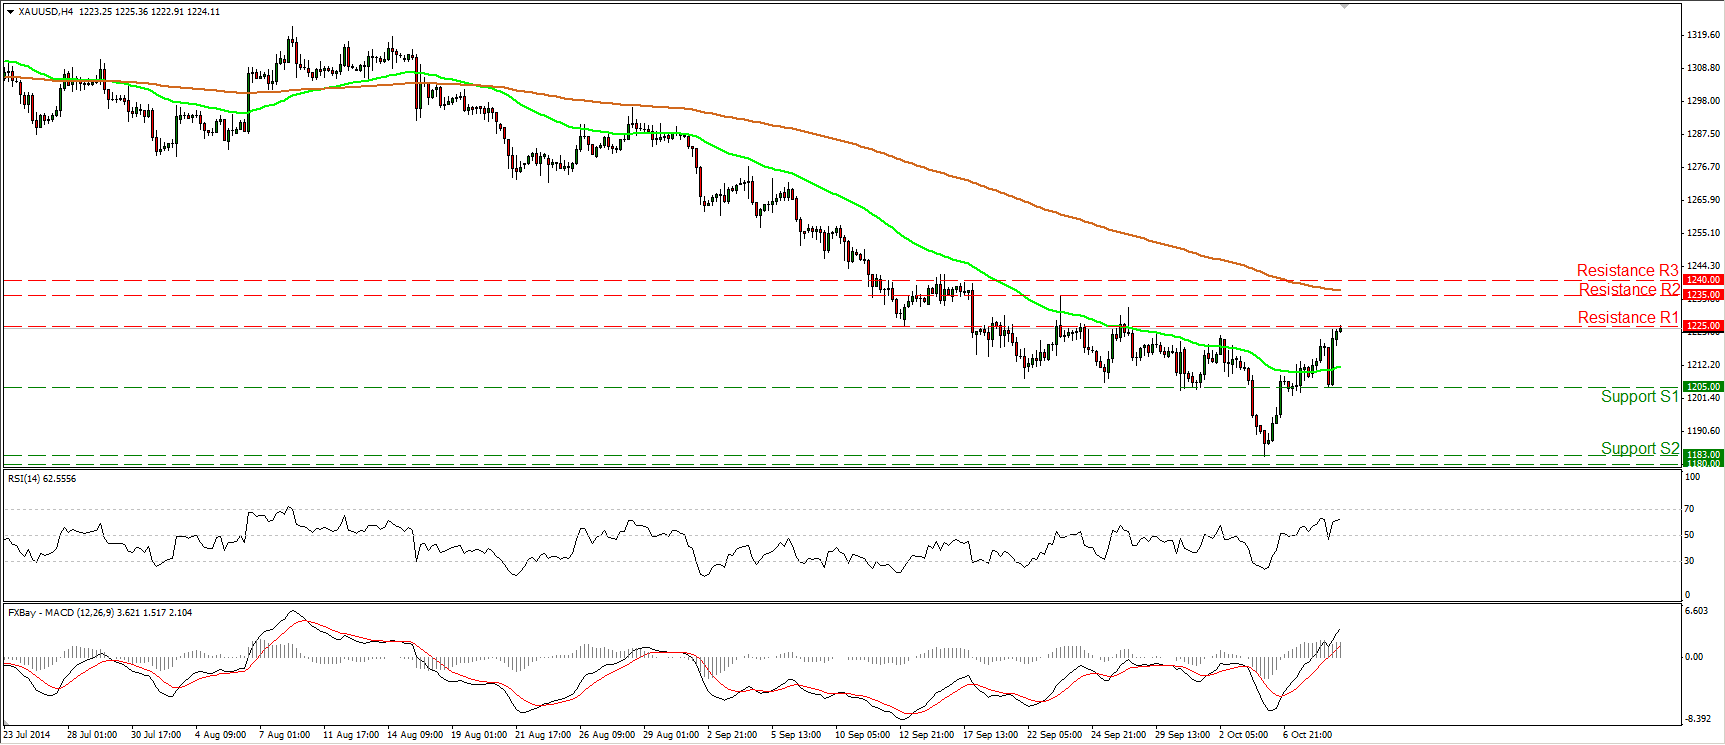
Gold edged higher on Wednesday after finding support at 1205 (S1), and managed to reach the resistance zone of 1225 (R1). I would expect a break above that barrier to signal the extension of the bullish wave and perhaps target the 1235/1240 area. The RSI rebounded from its 50 line and moved higher, while the MACD lies above both its zero and signal lines. This designates bullish momentum and amplifies the case for further upside in the close future. Although I would expect further upside in the short term, on the daily chart, the price structure still suggests a downtrend, thus I would prefer to maintain my flat view as far as the overall picture is concerned. The reasons remain the same as in previous comments. On Monday, the metal rebounded strongly from the critical support zone of 1180/83, defined by the lows of June and December 2013, but the absence of any bullish trend reversal signals makes it too early to argue about any uptrend scenarios, in my view.
• Support: 1210 (S1), 1183 (S2), 1180 (S3)
• Resistance: 1223 (R1), 1235 (R2), 1240 (R3)
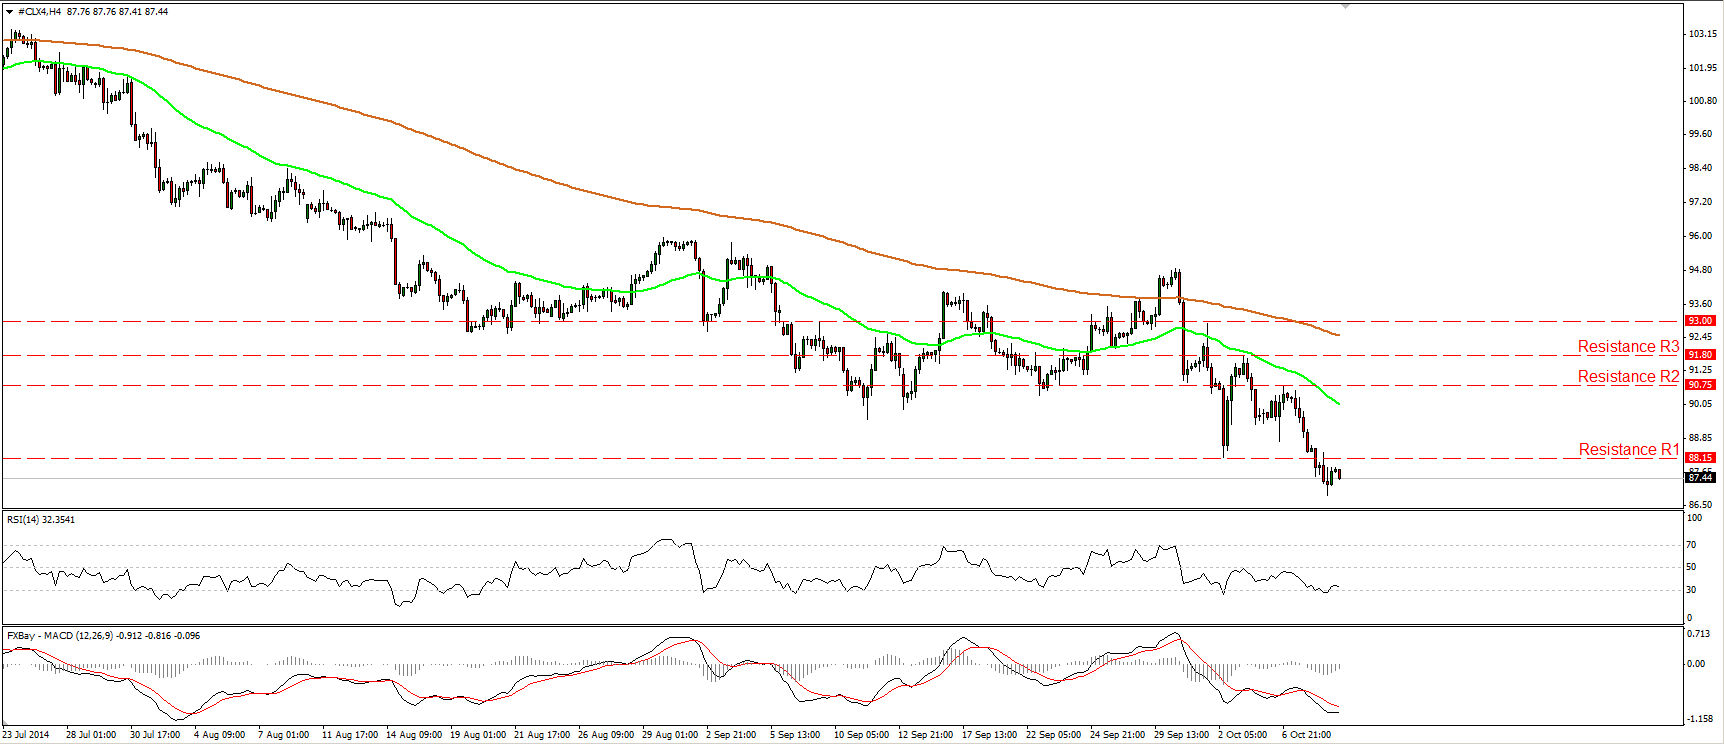
WTI dips below 88.15
WTI continued declining on Wednesday after the US Energy Information Administration reported that stockpiles in the US rose by much more than anticipated last week. WTI reached and dipped below the support (turned into resistance line) of 88.15, confirming a forthcoming lower low on the daily chart and signaling the continuation of the broader downtrend. I would now expect the bears to challenge our support area of 86.00 (S1). Both of our daily momentum studies confirm the recent accelerating negative momentum. The 14-day RSI continued lower, while the MACD remains below both its zero and signal lines, pointing down.
• Support: 86.00 (S1), 84.15 (S2), 82.00 (S3)
• Resistance: 88.15 (R1), 90.75 (R2), 91.80 (R3)

