With Tuesday's release of the June S&P/Case-Shiller Home Price we learned that seasonally adjusted home prices for the benchmark 20-city index were down month over month at -0.1%. The seasonally adjusted year-over-year change has hovered between 4.4% and 5.4% for the last twelve months.
 The adjacent column chart illustrates the month-over-month change in the seasonally adjusted 20-city index, which tends to be the most closely watched of the Case-Shiller series. It was down -0.1% from the previous month. The nonseasonally adjusted index was up 5.1% year-over-year.
Investing.com had forecast a -0.1% MoM seasonally adjusted decrease and 5.2% YoY nonseasonally adjusted for the 20-city series.
Here is an excerpt of the analysis from today's Standard & Poor's press release.
"Home prices continued to rise across the country led by the west and the south,” says David M. Blitzer, Managing Director and Chairman of the Index Committee at S&P Dow Jones Indices. “In the strongest region, the Pacific Northwest, prices are rising at more than 10%; in the slower Northeast, prices are climbing a bit faster than inflation. Nationally, home prices have risen at a consistent 4.8% annual pace over the last two years without showing any signs of slowing.
Overall, residential real estate and housing is in good shape. Sales of existing homes are at running at about 5.5 million units annually with inventory levels under five months, indicating a fairly tight market. Sales of new single family homes were at a 654,000 seasonally adjusted annual rate in July, the highest rate since November 2007. Housing starts in July topped an annual rate of 1.2 million units. While the real estate sector and consumer spending are contributing to economic growth, business capital spending continues to show weakness." [Link to source]
The chart below is an overlay of the Case-Shiller 10- and 20-City Composite Indexes along with the national index since 1987, the first year that the 10-City Composite was tracked. Note that the 20-City, which is probably the most closely watched of the three, dates from 2000. We've used the seasonally adjusted data for this illustration.

For an understanding of the home price data over longer time frames, we think a real, inflation-adjusted visualization of the data is an absolute necessity. Here is the same chart as the one above adjusted for inflation using a subcomponent of Bureau of Labor Statistics' Consumer Price Index, the owners' equivalent rent of residences, as the deflator. Among other things, the real version gives a better sense of the dynamics of the real estate bubble that preceded the last recession.

The next chart shows the year-over-year Case-Shiller series, again using the seasonally adjusted data.

Here is the same year-over-year overlay adjusted for inflation with the Consumer Price Index owners' equivalent rent of residences.

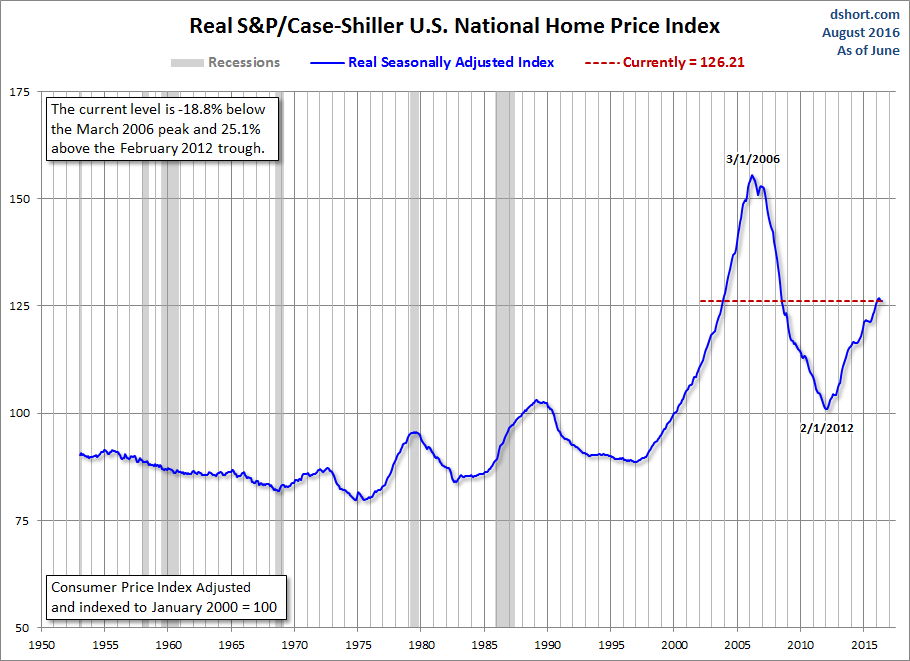
For a long-term perspective on home prices, here is a look at the seasonally and inflation-adjusted Case-Shiller price index from 1953, the first year that monthly data is available. Because the CPI owners' equivalent rent of residences didn't start until 1983, we've used the broader seasonally adjusted Consumer Price Index.