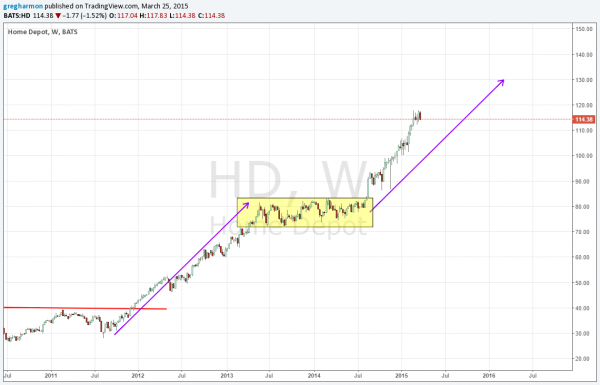
Home Depot (NYSE:HD) was a stock-market darling from mid 2011 to mid 2013. It ran out of a base of over 40 to a new base between 73 and 83. Then it pushed higher again. It now sits -- consolidating in the weekly chart below -- at about 115. That's quite a run but the Measured Move suggests its run may not be over. It may have up to 130 in its future.
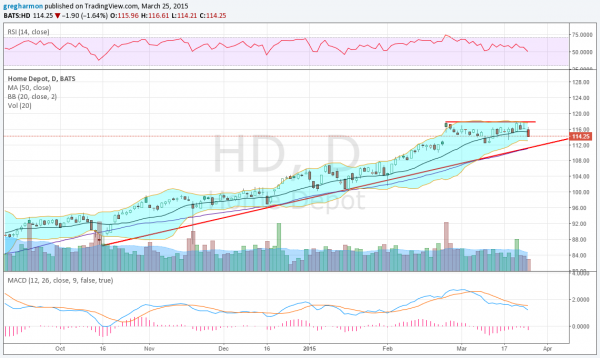
So you might think it's time to buy Home Depot. But that's not the case. No move goes straight in one direction all the time. And when you take a closer look at the price action -- as on the daily timeframe below -- it appears there may be a pullback in the cards. So what do you do when you want to own a stock that is in a long-term uptrend, but is pulling back? One thing you can do is wait for the pullback to end and then buy it. A simple strategy for sure, but one that requires patience. There's a second alternative, though. Use options to design a trade now that may get you into the stock lower when you can make money as it falls.
Take a closer look at the one-day chart above. The RSI is making a lower low and the MACD is falling as the price is moving below the 20-day SMA. That supports a downside move while also staying in a bullish range. The rising trend support line in red is now riding the 50-day SMA higher. That 50-day SMA has been support several times during pullbacks in this move higher. If you believe that the longer trend continues, this chart is a road map to a better entry.
First some mechanics. Pullbacks tend to happen faster than grinds higher -- the trade will look to gain an entry or make money over the next 3 weeks. This is prior to the next earnings release in late May. So look for an entry just below the trend and 50-day SMA. To accommodate that you could buy an April 114/112-111 1×2 Put Spread, which means buying the April 114 Put and selling both an April 112 and 110 Put. Putting on this trade is free as long as the cost of the long Put is covered by the credit from the 2 short Puts.
At a price between 112 and 110 at April Expiry, you make $2 on the trade. Above 114 you make nothing and all the options expire. And below 110 you will be put the stock with a basis of 108. So the profit zone is from 114 to 108. This trade does, however, require margin make. But it is the same margin you would use if you bought the stock, like you were going to do originally.


