
Hologic Inc. (NASDAQ:HOLX) reported third-quarter fiscal 2016 adjusted earnings per share (EPS) of 51 cents, up 18.6% year over year. Adjusted EPS also beat the Zacks Consensus Estimate by 8.5% and exceeded the company guidance of 47–48 cents.
Management believes the company’s capital deployment efforts have led to its EPS increase significantly faster than revenue.
On a reported basis, the company recorded net income of $84.8 million or 30 cents per share, reflecting a massive year-over-year improvement of 188.1% or 200%, respectively.
Revenues in Detail
Revenues grossed $717.4 million in the quarter, up 3.4% year over year. The top line also comfortably exceeded the Zacks Consensus Estimate of $702.2 million and the company's estimation of $695–$705 million. At constant exchange rate (CER), revenue growth was 3.6%. Excluding the headwind from discontinued products, revenue growth was 4.6% (up 4.8% at CER), in the third quarter.
Solid growth in all of Hologic’s four business segments, led by GYN Surgical drove the year-over-year growth in the top line. However, the third-quarter growth rates were impacted by the exceptionally strong performance the company delivered in the prior year period, when revenues increased by 9.7% on a year-over-year basis.
Geographically, revenues in the U.S. increased 4.7% year over year to $564.9 million on the back of persistent strong recent trends. On the other hand, international revenues dropped 1.2% (down 0.4% at CER) to $152.5 million, due to inventory fluctuations in blood screening.
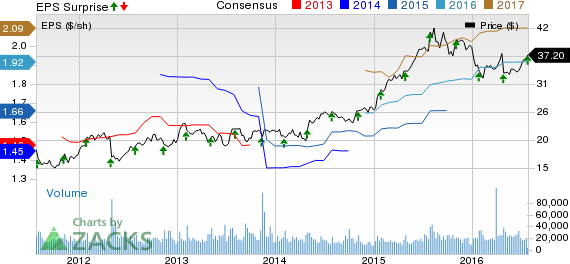
HOLOGIC INC Price, Consensus and EPS Surprise
HOLOGIC INC Price, Consensus and EPS Surprise | HOLOGIC INC Quote
Segments in Detail
Sales at the Diagnostics segment (43.2% of total revenue) grew 1 % year over year (up 1.2% at CER) to $309.9 million in the quarter. Growth was primarily driven by global molecular diagnostics and cytology and perinatal revenues, which improved 6% and 3.9%, respectively, at CER. However, revenues from blood screening products dropped 12.9% at CER.
Sales from the Breast Health segment (39.3%) rose 1.1% (up 1.1% at CER) to $282.5 million. Growth was primarily driven by domestic sales of 1.9%, on the back of continuous strong adoption of Hologic’s Genius 3D mammography test despite facing tough year over year comparison.
Sales from the GYN Surgical business (14.2%) improved 19.3% (up 19.8% at CER) to $102 million, on account of 29.4% (29.8% at CER) growth in MyoSure system sales and 13.9% ( up 14.6% at CER) growth in NovaSure system. Revenues from Skeletal Health (accounting for the rest) grew 4.8% (4.8% at CER) to $23 million, driven by higher demand for Hologic’s Horizon bone density scanner.
Operational Update
In the third quarter, Hologic’s gross margin expanded 20 basis points (bps) to 54.8%, while adjusted gross margin improved 50 bps to 65.7%. This improvement can be attributed to strong domestic sales growth, favorable product mix, and operational improvement.
Hologic's adjusted operating expenses amounted to $229.2 million, up 3.1% year over year on account of the company’s planned investments in Breast Health and Diagnostics marketing, and increased selling expenses. Nevertheless, adjusted operating margin expanded 60 bps to 33.8%, owing to higher gross profit.
Financial Update
Hologic exited the reported quarter with cash and cash equivalents of $441.5 million, comparing favorably with $316.3 million reported at the end of the second-quarter fiscal 2016. Long-term debt (net of current portion) as on Jun 25, 2016 was $3.09 billion, compared with $3.10 billion at the end of the previous quarter.
Operating cash flow in the quarter was $560.5 million, up 1.2% from the year ago quarter’s equivalent. During the third quarter, Hologic repurchased 3.0 million shares of its common stock for $101.2 million, exhausting the company's prior $250 million share repurchase program. Management has recently authorized a new, five-year, $500 million repurchase program for Hologic.
Fiscal 2016 Guidance
Hologic updated its guidance for fiscal 2016. Encouraged by its solid performance in the third-quarter fiscal 2016, the company has raised the lower end of its earlier announced revenue guidance and currently expects revenues in the range of $2.82–$2.83 billion (against the prior guidance of $2.81–$2.83 billion).
This new revenue guidance reflects annualized growth of 4.3%–4.6% on a reported basis and 5%-5.3% at CER, higher than earlier guidance of 3.9%–4.6% and 4.6%–5.4%, respectively. The current Zacks Consensus Estimate of $2.82 billion coincides with the lower end of the company provided guidance.
Hologic has raised its EPS outlook for fiscal 2016. The company currently projects adjusted EPS in the range of $1.93–$1.94 for fiscal 2016 (reflecting annualized growth of 15.6%-16.2% and 16.9%–17.5% at CER), higher than the previous range of $1.89–$1.91 (reflecting annualized growth of 13.2%–14.4% and 14.6%–15.8% at CER). The current Zacks Consensus Estimate for adjusted EPS is pegged at $1.91, below the company guided range.
For fourth-quarter fiscal 2016, Hologic expects revenues of $714–$724 million, representing annualized growth of 1.6%–3% and 2.1%–3.6% at CER. Adjusted EPS is projected at 49–50 cents (reported growth of 14%–16.3% and 15%–17.3% at CER). The current Zacks Consensus Estimate for fourth-quarter revenues and EPS are pegged at $730.4 million and 50 cents, respectively.
Our Take
Hologic ended third-quarter fiscal 2016 on a promising note, with both its top and bottom line comfortably exceeding the Zacks Consensus Estimate. The company’s strong cash balance position also encourages us. Besides the recently authorized share repurchase program worth $500 million is further indicative of the strong cash position Hologic currently holds. However, the company witnessed a slump in its blood screening business this quarter, as per management’s expectation, owing to higher orders received in the prior-year period.
Moreover, we are impressed to note that despite the higher operating expenses, Hologic observed operating margin expansion. This reflects the company’s ability to generate additional operating leverage from growth in most of its most profitable products, even after making a handful of investments. The company’s raised outlook makes us optimistic, by its indication of likely expansion of Hologic’s business, going forward.
Zacks Rank & Other Key Picks
Hologic currently holds a Zacks Rank #2 (Buy). Other favorably ranked medical stocks are Abiomed, Inc. (NASDAQ:ABMD) , Masimo Corporation (NASDAQ:MASI) and Natus Medical Inc. (NASDAQ:BABY) . All these stocks sport a Zacks Rank #1 (Strong Buy).
HOLOGIC INC (HOLX): Free Stock Analysis Report
ABIOMED INC (ABMD): Free Stock Analysis Report
MASIMO CORP (MASI): Free Stock Analysis Report
NATUS MEDICAL (BABY): Free Stock Analysis Report
Original post
Zacks Investment Research