Technical Outlook:
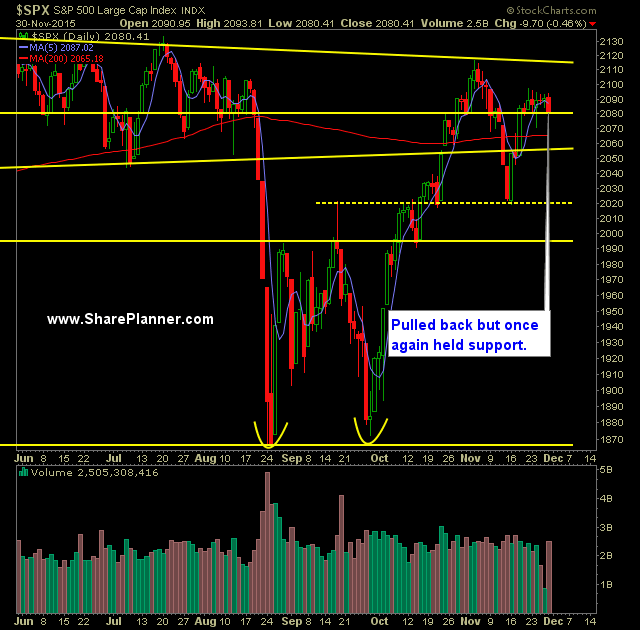
- A respectable dose of selling yesterday that saw S&P 500 pullback to support as noted in the chart below.
- For the month, S&P 500 managed to finish 1.05 points higher - a move of 0.05%. Essentially the market spent the past month doing nothing.
- S&P 500 pulled back perfectly to the 20-day moving average as well as the 10-day moving average while breaking down and below the 5-day moving averages.
- First day of the month can often times see significant moves take place in either direction. December, historically, is a very positive month for the market and I'll look for the that to hold true this year as well.
- Volume came back yesterday as the market traded at average levels.
- S&P 500 30 minute chart is starting to show some distribution tendencies in the market. Today's gap up will need to hold and ultimately break out of the seven-day narrow trading the range the market has been in.
- CBOE Volatility Index popped yesterday 6.7% and back over 16 to settle at 16.13. Ultimately, I don't see this market seeing any heavy selling until it gets into the 11-12 range on VIX.
- T2108 (% of stocks trading above their 40-day moving average) has shown very little movement of late, dropping 3% yesterday to settle in at 52%.
- I am still expecting at some point for there to be a break to the upside to challenge the rally highs and ultimately S&P 500's all-time highs.
- The rising trend-line off of the September lows should be a strong support level for the market should this market breakdown. Its current support level rests at 2062.
- Declining resistance off of the May highs on S&P 500 still rests at 2116.
- SPDR S&P 500 (N:SPY) is essentially sitting in the middle of the range that has plagued the market all year long, outside of the August/September sell-off.
- A massive inverse head and shoulders pattern is forming on S&P 500 that is worth following. A move above 2116 area would confirm the pattern.
- For twelve years straight, the market over the course of the last 30 trading days of the calendar year, has yielded a net positive gain, and thus reinforcing the concept of the "Santa Rally".
- A rate hike is expected out of December's Fed meeting. However, I still would not be surprised if the Fed backed out of raising rates yet again. They've been doing just that for years now.
My Trades:
- Sold Tesoro Corporation (N:TSO) yesterday at $115.44 for a 1.7% gain.
- Sold Facebook Inc (O:FB) yesterday at $104.10 for a -0.7% loss.
- Added two new swing-trades to the portfolio yesterday.
- Will consider adding one to two new long position to the portfolio today, while also managing the profits on existing positions.
- 60% Long / 40% Cash
- Remain long: Agilent Technologies Inc (N:A) at $39.66, Amazon.com Inc (O:AMZN) at $673.85, Allscripts Healthcare Solutions Inc (O:MDRX) at $14.85, Eaton Corporation PLC (N:ETN) at $58.12 and two other positions.

