Every quarter we are "surprised" by the headline GDP number which can go up, then down, then up ... The most recent quarter being reported says the real economy is growing at 4.2%. Am I the only one who believes this is a lie?
Follow up:
Okay, "lie" is the wrong word - but 4.2% bares no relationship helping one understand what is going on. The economy is not growing at 4.2% relative to last year - but 4.2% relative to last quarter. And as last quarter was "bad", 4.2% growth relative to last quarter only tells you that our 4.2% quarter is better than last quarter's 2.1% contraction. But 4.2% fails to quantify the real GDP growth overall. From the BLS:
Quarterly estimates are expressed at seasonally adjusted annual rates, unless otherwise specified. Quarter-to-quarter dollar changes are differences between these published estimates. Percent changes are calculated from unrounded data and are annualized. "Real" estimates are in chained (2009) dollars. Price indexes are chain-type measures.
So what we have is headline GDP bouncing around like a yo-yo because it is compared to the previous quarter. We end up with data gathering errors (because the quarter's numbers are multiplied by 4 to annualize). This means we end up with significant methodology errors because quarterly errors are multiplied by 4.
Note: This is an overstatement of actual volatility when considering year-over-year changes because many of the quarterly errors are random sampling and adjustment errors - and random errors average to smaller numbers over a number of sequential measurements.
The graph below demonstrates the difference between using the previous quarter as the reference point for determining headline GDP (blue line in graph below), and using the same quarter one year ago as the reference (red line in graph below).
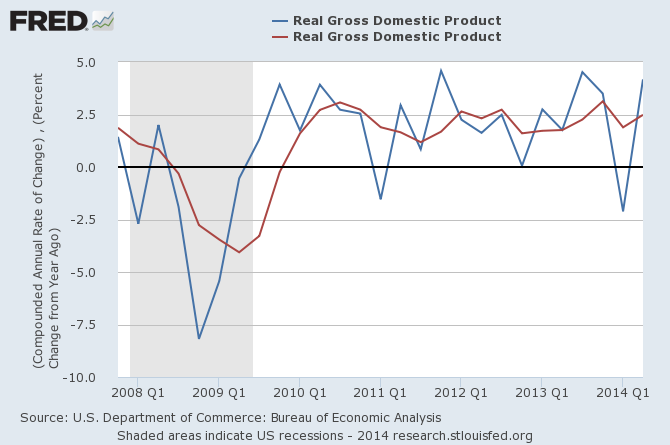
Was the primary reason for the 2.1% contraction in 1Q2014 due to weather (yes, bad weather effects the economy) - or was the primary reason for weak 1Q2012 growth due to 4Q2013 excellent growth being an anomaly (causing 1Q2014 to appear weak in comparison)?
The real takeaway from the above graph is that since mid-2010 the economy has generally remained in a range between 2.0% and 2.5%. There is little evidence showing on the red line in the above graph of:
a strengthening economy trend;
a weakening economy trend;
the stimulus beginning or ending;
quantitative easing beginning or ending;
the effect of Europe's economic difficulties on the USA economy;
the end of the Iraq War; or,
austerity.
Obviously each dynamic mentioned above effects the economy, but when added as part of the whole - little noticeable effect is evident. What we have is 'New Normal' economic growth between 2.0% and 2.5% being the trend using GDP as the measure.
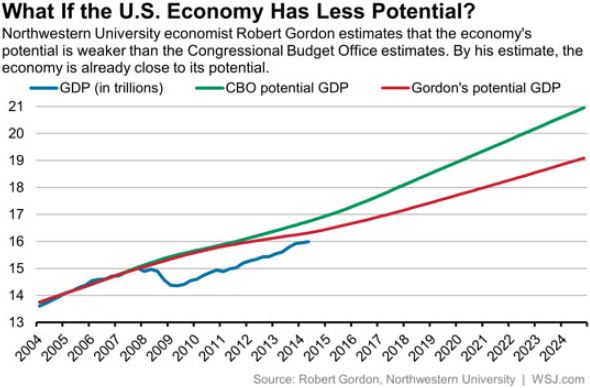
The 'New Normal' rate above has yet to experience a recession which is expected to occur every few years, perhaps twice in the next ten years. A new estimate for GDP going forward by Prof. Robert J. Gordon, Northwestern University, gives the potential GDP growth over the next decade to have an annual average rate of 1.6%.
Other Economic News this Week:
The Econintersect Economic Index for September 2014 is showing our index declined from last months 3 year high. Outside of our economic forecast - we are worried about the consumers' ability to expand consumption although data is now showing consumer income is now growing faster than expenditures growth. The GDP expansion of 4.2% in 2Q2014 is overstated as 2.1% of the growth would be making up for the contraction in 1Q2014, and 1.4% of the growth is due to an inventory build. Still, there are no warning signs that the economy is stalling.
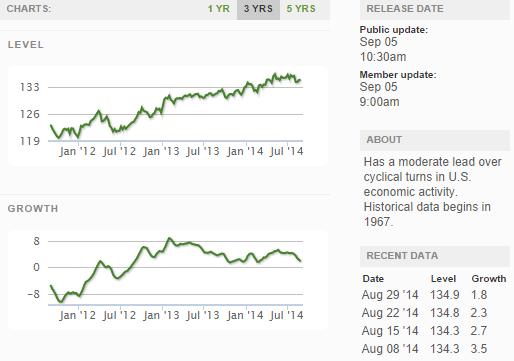
The ECRI WLI growth index value has been weakly in positive territory for almost two years. The index is indicating the economy six month from today will be slightly better than it is today.
Current ECRI WLI Growth Index
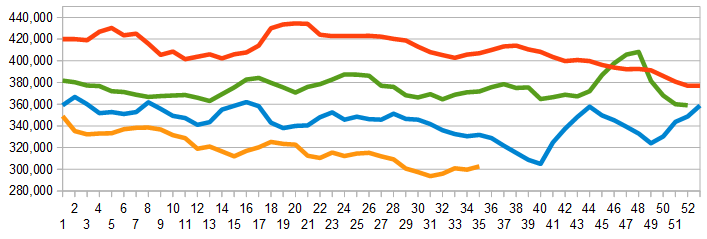
The market was expecting the weekly initial unemployment claims at 290,000 to 310,000 (consensus 300,000) vs the 302,000 reported. The more important (because of the volatility in the weekly reported claims and seasonality errors in adjusting the data) 4 week moving average moved from 299,750 (reported last week as 299,750) to 302,750.
Weekly Initial Unemployment Claims - 4 Week Average - Seasonally Adjusted - 2011 (red line), 2012 (green line), 2013 (blue line), 2014 (orange line)
Bankruptcies this Week: None
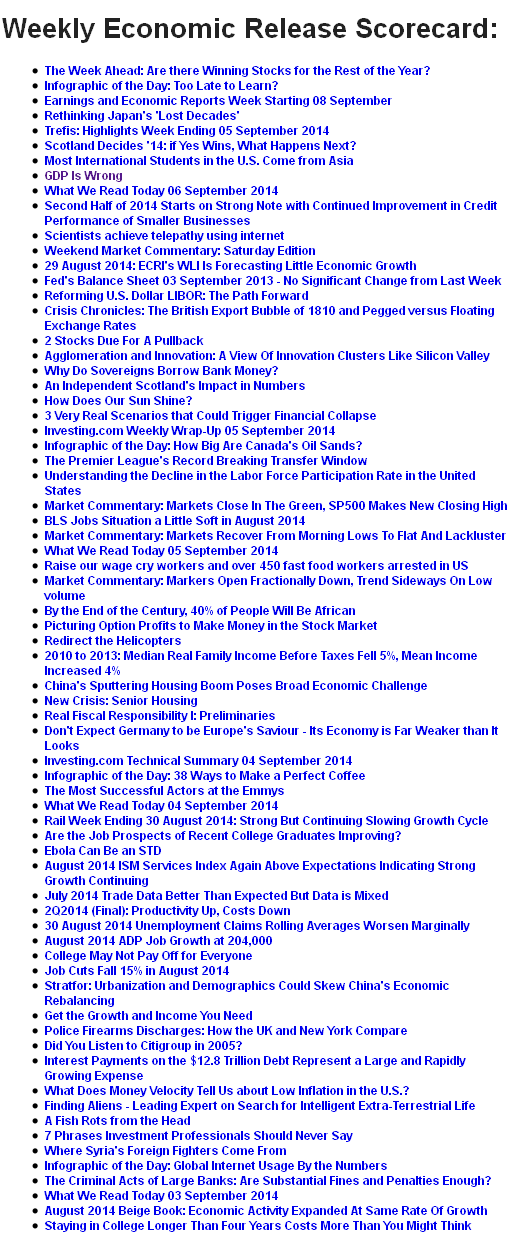
Weekly Economic Release Scorecard:
Click here to view the scorecard table below with active hyperlinks
