Is it the “smart money” or the “dumb money” that has been seeking safer portfolio pastures throughout 2015? Time itself will tell. That said, riskier assets have been buckling clear across the asset board.
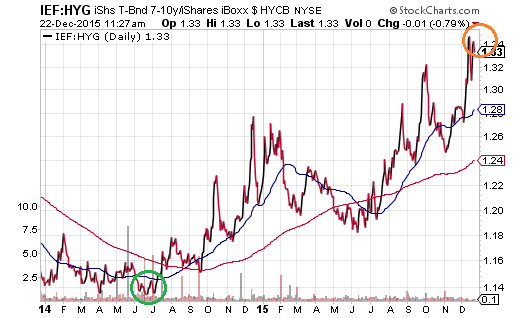
Consider the iShares 7-10 Year Treasury Bond (N:IEF): iShares iBoxx $ High Yield Corporate Bond (N:HYG) price ratio. A rising IEF:HYG price ratio signals an increasing desire for the perceived safety of U.S. treasuries over the higher yield-producing income of comparable corporates. The ratio has not been this high since mid-2014.
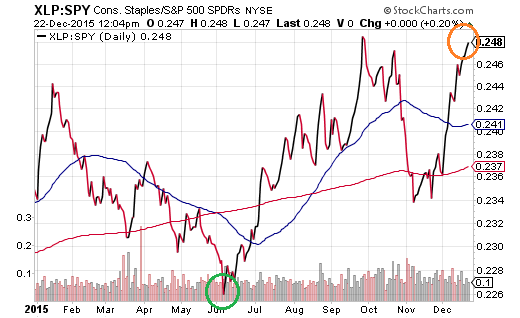
Another relationship that typically offers insight into investor risk preferences is the Consumer Staples Select Sector SPDR (N:XLP): SPDR S&P 500 (N:SPY) price ratio. When there is skittishness about the economy, cigarette makers, soda pop providers and toothpaste purveyors tend to outperform the broader large-cap market of U.S. stocks. As it stands, momentum for XLP relative to SPY is near 52-week highs.
Comfort seeking in treasury bonds over low-level investment grade bonds and higher-yielding junk bonds? A preference for recession-proof staples over the wider large-cap asset class? These are signs that momentum currently favors less risky alternatives.
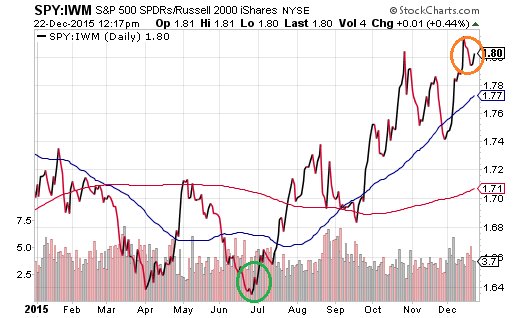
Indeed, there are plenty of additional examples where the less risky asset is outperforming the riskier selection. Compare the perceived safer world of large-company stocks versus the perceived riskiness of owning small-company stocks via the iShares Core S&P 500 (N:IVV): iShares Russell 2000 (N:IWM). Like most price ratio comparisons today, the lower risk option is experiencing far greater demand than the higher risk option.
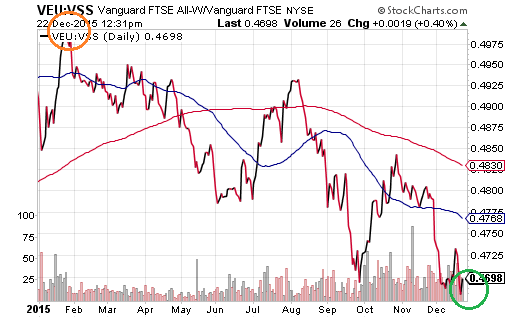
There are exceptions to the rule. For example, in foreign markets, large caps are underperforming small caps. This can be seen in the Vanguard FTSE All World ex US (N:VEU): Vanguard FTSE All-World ex-US Small-Cap (N:VSS) price ratio.
One possible reason for the trend toward the perceived riskier asset? Large foreign corporations are exceptionally dependent on international trade; lackluster world demand has put enormous pressure on exporters. In contrast, smaller companies around the globe are more dependent on their local economies as opposed to global trade. Another possible explanation? International small-caps have been beaten down so far that some may perceive them as more attractive from a valuation standpoint.
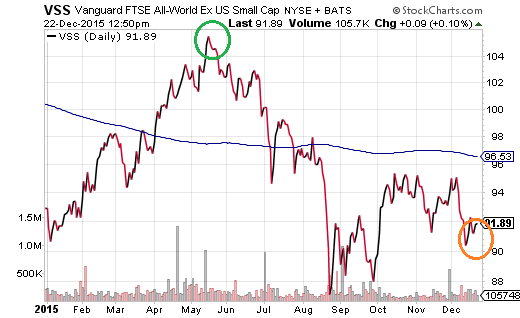
However, relative strength in small-cap international stocks relative to larger-company brethren is not an indication of greater demand for riskier international holdings. In fact, like the overwhelming majority of “risk-on” asset classes, small-cap international stocks via VSS have been faltering since May. In particular, VSS is more than 10% below its 52-week high and remains well below its long-term 200-day moving average.
With the U.S. economy showing signs of deceleration and U.S. stocks exhibiting unrestrained overvaluation, few should be caught off guard by waning enthusiasm for risk taking. One fact that looms particularly large? Year-to-date, more stocks in the U.S. have been declining than advancing for the first time since 2009.
In sum, history has rarely been kind to those who ignore common sense warning signs. If you have long-term winners in your portfolio, restore those assets or asset classifications back to your original allocation. The cash that you raise from “pruning” will help you buy desirable assets at bargain prices in the future. If you have been holding onto losing vehicles, consider taking a small loss on each. The dollars that you raise from “cutting bait” will help you buy the best fish in the sea when those fish are attractively priced.
Disclosure: Gary Gordon, MS, CFP is the president of Pacific Park Financial, Inc., a Registered Investment Adviser with the SEC. Gary Gordon, Pacific Park Financial, Inc, and/or its clients may hold positions in the ETFs, mutual funds, and/or any investment asset mentioned above. The commentary does not constitute individualized investment advice. The opinions offered herein are not personalized recommendations to buy, sell or hold securities. At times, issuers of exchange-traded products compensate Pacific Park Financial, Inc. or its subsidiaries for advertising at the ETF Expert web site. ETF Expert content is created independently of any advertising relationships.

