
Trend Model signal summary
Trend Model signal: Neutral (downgrade)
Trading model: Bearish (downgrade)
The Trend Model is an asset allocation model which applies trend following principles based on the inputs of global stock and commodity price. In essence, it seeks to answer the question, "Is the trend in the global economy expansion (bullish) or contraction (bearish)?"
My inner trader uses the trading model component of the Trend Model seeks to answer the question, "Is the trend getting better (bullish) or worse (bearish)?" The history of actual (not backtested) signals of the trading model are shown by the arrows in the chart below. In addition, I have a trading account which uses the signals of the Trend Model. The last report card of that account can be found here.

Update schedule: I generally update Trend Model readings on weekends and tweet any changes during the week at @humblestudent.
A possible growth scare on the horizon
The Trend Model threw in the towel on the bullish call last week as readings deteriorated sufficiently to move the gauge to "neutral" for my inner investor, which translated into a trading "sell" signal for my inner trader. In case you missed it, I tweeted the following on Wednesday, April 1:

At the heart of the downgrade is a growth scare that is starting to grip the markets. The Atlanta Fed's GDPNow nowcast of 1Q GDP growth has tanked from 2% in February to 0.1% today - and that is starting to cause concerns.

Doug Short`s Big 4 Recession Indicators have turned negative.

Before we all panic about a coming recession, I would point out that the deterioration is attributable to the softness in real sales, while the other three components of the index remain positive.

Forecasters, such as Ed Yardeni, who has had a bullish tilt, are now sounding a bit uncertain:
On March 18, I observed that spring is coming. Just as I predicted, it started two days later on March 20. On the other hand, the latest batch of economic indicators for March suggests that I may have been too optimistic when I wrote: “I agree with Chauncey Gardiner’s prediction: ‘In the spring, there will be growth.'”
I argued that the economy’s weakness during the first two months of the year reflected an ice patch rather than a soft patch. There are still grounds for optimism as the ground thaws. However, the latest data suggest that it could be a cold spring:
Yardeni went on to cite business surveys, specifically the soft ISM report, and employment (and this was before the big NFP miss Friday) as his reasons for cautiousness. Scott Grannis also had a good summary of the growth concerns facing the market, here.
Earnings estimates are also looking a little wobbly. The latest update from John Butters of Factset shows that forward EPS estimates are starting to flatten out after recovering from the double whammy of falling oil prices (which affect Energy and Materials) and rising USD strength (chart annotations are mine):

The huge NFP miss on Friday did not help matters. The 126K print (vs. 245K expected) was a shocker, but I pointed out that the Fed was mainly watching for inflationary pressures (see Why you should discount the headline NFP number).
We now have the worst of both worlds. There are signs of weakening employment growth, which the Fed discounts as being transitory, but the market interprets as faltering growth. We also have signs of rising inflationary pressures. Average Hourly Earnings ticked up, which will not change the Fed`s likely path of interest rate normalization. As things stand now, the Fed may be tightening just as economic growth stalls.

Indeed, the slowdown story has gone mainstream. Just look at the weekend headline on Marketwatch:

These are all indications of an impending soft patch in stock prices.
Mr. Market gets nervous
The stock markets have responded accordingly. I mentioned last week the lack of confirmation of the trend break in the SPX, along with uptrends in a number of other measures, as reasons for my bullishness (see Risk-reward skewed to the upside). The picture is a bit more uncertain today. As the chart below shows, the technical uptrend has been violated in the SPX and NASDAQ. In addition, the Dow is looking very iffy, especially in light of the big downdraft in futures in the wake of the big NFP miss on Friday. Only the small cap Russell 2000 remains in an uptrend.

Using the 50 day moving average as a metric, the intermediate-term trend is starting to falter on a global basis. Both the SPX and FTSE 100 have violated their 50 dma (and the DJ Global Index is currently testing that level). These conditions indicate a loss of momentum in other parts of the world.

Just as worrying is the poor relative performance of cyclically sensitive industrial sectors of the stock market. The top panel of the chart below shows that the relative market performance of Industrial stocks (via the Industrial Sector SPDR Trust ETF (ARCA:XLI)) compared to the market (via SPDR S&P 500 (ARCA:SPY)) has violated a relative support level and is in a downtrend. Because XLI is heavily weighted with GE, the second panel shows the equal weighted Industrial stocks (via Guggenheim S&P Equal Weight Industrials (NYSE:RGI)) against an equal weighted SPX (via Guggenheim S&P Equal Weight (NYSE:RSP)) - and that chart looks even worse. The third panel shows the relative performance of the cyclically sensitive semiconductors (via Market Vectors Semiconductor (NYSE:SMH)), which has violated a relative uptrend and showing signs of rolling over.

The bottom three panels are reminders of the non-confirmation of the Dow Theory buy signal, as the Dow Jones Transportation Average is far weaker than theDow Jones Industrials Average and the DJTA is now testing a key support level - which could easily be breached on Monday should the weakness in the futures market continue.
Commodities (via the CRB Index) and commodity related indicators are also starting to act up. The failure of commodities to sustain a rally, especially the all-important cyclically sensitive industrial metals, and the weakness in the AUD/CAD exchange rate (which is an indirect measure of Chinese demand as Australia is more China sensitive but Canada is more US sensitive) are worrying. These may be early signs of faltering global demand.

Sentiment models suggest more weakness
In addition, sentiment models are tilting bearishly. I prefer to watch sentiment readings that indicate what people are actually doing with their money rather than opinion surveys, which can be volatile and fickle. As an example, the latest Rydex fund flows suggest that Rydex investors are tilted bullishly, though they are pulling back. At the very least, this group has a lot further room to panic should stock prices hit an air pocket.

By contrast, the latest data from Barron's show that insiders, who are regarded as the "smart money", are selling a lot more stocks than they are buying.

Risk appetite still healthy
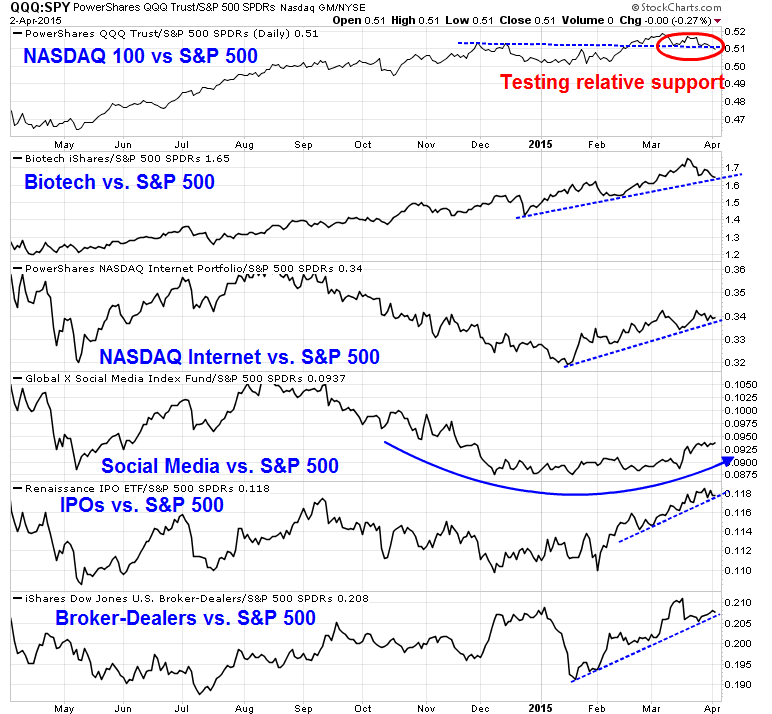
To be sure, the technical picture isn't all gloomy. My measures of risk appetite remain healthy. This chart of the relative performance of the high-beta and glamour groups of the stock market all appear to be constructive (via PowerShares QQQ (NASDAQ:QQQ), iShares NASDAQ Biotech ETF (NASDAQ:IBB), PowerShares NASDAQ Internet ETF (NASDAQ:PNQI), Global X Social Media Index (NASDAQ:SOCL), Renaissance IPO ETF (NYSE:IPO) and iShares DJSU Broker-Dealers Index (NYSE:IAI)).
In addition, there are also no signs of panic from the HY market as yield spreads have narrowed.

I am also encouraged by the constructive performance of Greater China stock markets (via the Shanghai Composite, Hang Seng, Taiwan Weighted, KOSPI, and Australia's ALL ORDINARIES), which all remain in uptrends, as defined by their 50 dma: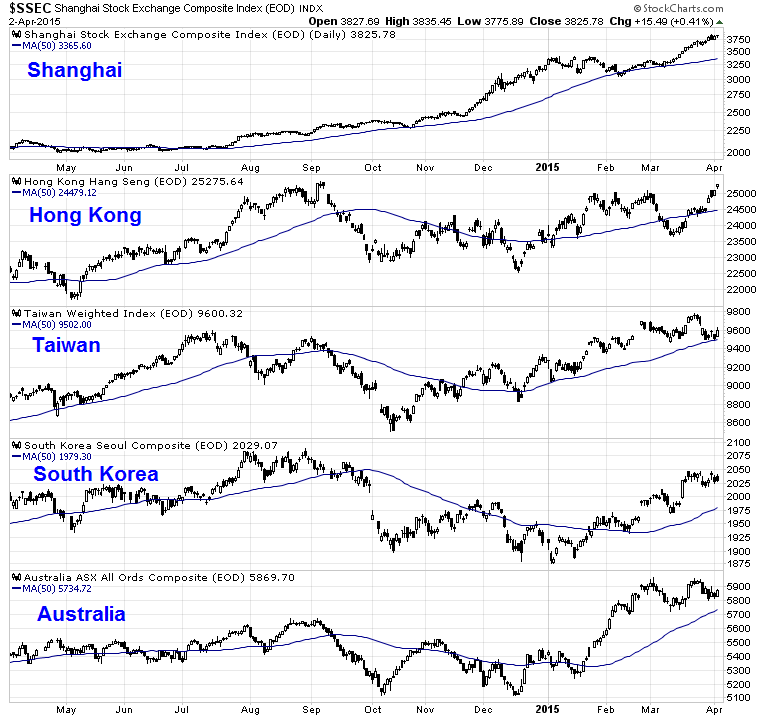
The technical condition of the Greater China stock markets stands in direct contradiction to the cautious signals of the commodity markets.
Temporary market weakness ahead
When I put it all together, the relatively sudden onset of growth nervousness is pointing to a minor hiccup in stock prices, which will likely amount to no more than 5% or so. The technical picture is indicative of more near term downside. ES futures have dropped about 1% in the wake of the Friday Employment Report:

A 1% drop would put the SPX just above the first support level of about 2040 (dotted blue line) shown in the chart below. However, the decline may not stop there. Both the 5-day RSI and 14-day RSI (top two panels) are not oversold, which is suggestive that more downside is possible. Should the first support level of 2040 get violated, the next logical support level is the support zone at about 1980-1990 (shown in grey).

I wrote last week that one of my concerns was that the market wasn't sufficiently oversold (see Risk-reward skewed to the upside, link above). In light of current technical conditions, it appears that we may need to see an oversold reading and investor capitulation before a durable bottom can be seen. Numerous measures from IndexIndicators.com illustrate the point that the market isn't oversold enough. Here is the chart of net 20 day highs and lows, whose reading is neutral:

Here is the chart of the average 14-day RSI in the SPX. The picture is the same:

I could go on, but you get the idea.
An air pocket first, then recovery
My base case scenario calls for some market weakness for the next 1-2 weeks, followed by a V-shaped bottom and recovery.
The bear case can be summed up simply. Growth expectations are getting revised downward. In addition, the Fed views 1Q GDP weakness as weather-related and transitory. The FOMC remains on track for a first rate in the June to September time frame.
On the other hand, the US economic recovery remains on course. Globally, we are likely to see more stimulative measures out of China and the positive effects of ECB QE as time progresses. As support for the medium-term bull case, I would make the following bullish points:
- New Deal democrat, who does an excellent job of monitoring real-time economic releases, described the current conditions as "poor coincident indicators with positive long and short leading indicators", which indicate that the current soft patch is temporary. However, he still "anticipate[s] a poor March industrial production number, and a poor Q1 GDP", which has the potential to spook the markets in the short run.
- Sam Eisenstadt remains bullish: A recent Mark Hulbert column on former Value Line research director Sam Eisenstadt, who is forecasting a September SPX level of 2310.
My inner investor has pared back some of his equity positions to the policy weight of stocks and bonds. My inner trader flipped from long to short last week in anticipation of lower stock prices this coming week. Should the market decline, he will be watching for oversold readings and signs of capitulation to reduce or cover his shorts.
Disclosure: Long SQQQ
Cam Hui is a portfolio manager at Qwest Investment Fund Management Ltd. ("Qwest"). This article is prepared by Mr. Hui as an outside business activity. As such, Qwest does not review or approve materials presented herein. The opinions and any recommendations expressed in this blog are those of the author and do not reflect the opinions or recommendations of Qwest.
None of the information or opinions expressed in this blog constitutes a solicitation for the purchase or sale of any security or other instrument. Nothing in this article constitutes investment advice and any recommendations that may be contained herein have not been based upon a consideration of the investment objectives, financial situation or particular needs of any specific recipient. Any purchase or sale activity in any securities or other instrument should be based upon your own analysis and conclusions. Past performance is not indicative of future results. Either Qwest or Mr. Hui may hold or control long or short positions in the securities or instruments mentioned.