Forex News and Events
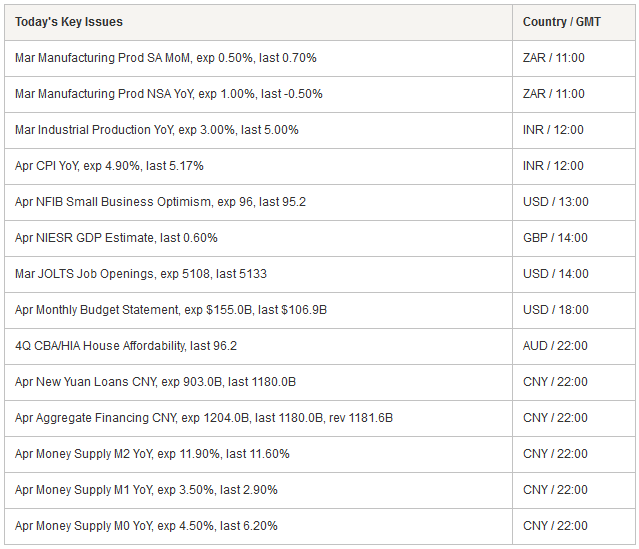
US JOLTS to be released
Today the US Labor Department is scheduled to release its Job Report for March including data for Jobs Openings (JOLTS). This data remains controversial as we question the trustworthiness of figures due to very lowest samples used for the report creation. The total US Job Openings figures will be released at 4 pm and expectations hover around 5ml jobs opening. Last February, JOLTS figures came in below expectations with 5’014ml vs 5’140ml expected. Despite the ADP miss to predict NFP, an unchanged NFP read indicates that JOLTS should also come in line with survey. Overall, the US Economy is still on track for a sustainable recovery with labor markets leading the way. EUR/USD is now trading sideways between 1.1250 and 1.1130.
Greece to pay debt with bailout money again
Over the few days, EUR grinded lower versus USD, amid the uncertainties of Greece’s repayment to the IMF. As the Greek saga is going on, we are still wondering if Greece will ever have the ability to pay off its debt. Let’s recall that Greece has a total debt around $320 Billion. In order to fulfill repayment, the terms of the bailout indicates the necessity for Greece to achieve a massive 4.5% surplus of the GDP each year.
Greece has confirmed late yesterday the payment of an installment of €750m to the IMF which adds up for a May total installment of around €2bn. Let’s point out the fact that Greece has also to reimburse to their overall creditors almost €7bn in June and also in July. We think that it is highly likely that Greece will manage to fully reimburse the IMF, however the other creditors may be at stake. In between Greece is expecting to receive a further €7.2bn of bailout by the end of June. We remain negative on the EUR/USD on Greek uncertainty and further monetary policy divergence. Recent unwind of USD long provides a good entry point to reload short EUR/USD positions.
G10 Rates Higher, AUD Higher, USD lower and EM in trouble
Risk sentiment improved significantly on the news that Greece’s finance ministry ordered a €750mn payment to the IMF. This easing of risk tensions has sparked a rally in developed markets yields (led by US and Germany rates). We are seeing the continuation of sizable moves on the mid-to-long end of G10 interest rates curves. Risk of a disorderly or straight non-payment by Greece has helped compress yields (as traders piled into safe haven). The lowering of this event risk is allowing capital to search for quality higher returns.
In particular, Australia yields have jumped pushing AUD higher verse the USD. The strong AUD was also supported by news that homes loans approval climbed 1.6% (verse 1.0%) in March. The RBA has been vocal regarding their concern over a “white hot” housing market. Todays, evidence that housing growth is accelerating will lessen the ability for the RBA to cut rates further. Should incoming data (starting with national federal budget) support the RBAs end of easing cycle stance, AUD should continue to appreciate. To that regard, China’s efforts to rejuvenated growth through monetary policy easing will certainly assist Australia’s growth outlook.
Elsewhere, the sharp rise in developed markets rates has hit EM currency hard. We are seeing heavy selling across the EM currency complex. Option markets are showing big jumps implied volatility. Countries with USD denominated current account deficits are extremely exposed at this moment. While most EM are vulnerable, RUB, INR, ZAR and TRY are prime for significant correction verse the USD. While yield starved investors might see EM rates as an opportunity, amidst the current sell-off, fear of a deeper carry unwind will keep risk seekers sidelined.
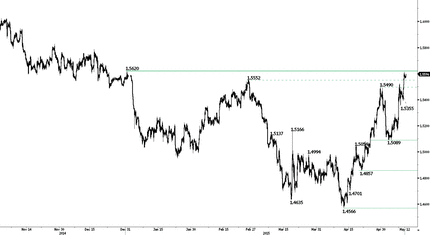
GBP/USD - Testing the resistance at 1.5620


The Risk Today
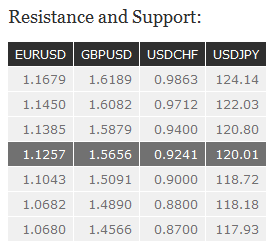
EUR/USD has broken the support found at 1.1334 confirming persistent selling pressures. A further test of strong support at 1.1187 is likely (see rising trendline). Hourly resistance now stands at 1.1255 (intraday high). In the longer term, the symmetrical triangle from 2010-2014 favors further weakness towards parity. As a result, we view the recent sideways moves as a pause in an underlying declining trend. Key supports can be found at 1.0504 (21/03/2003 low) and 1.0000 (psychological support). Break to the upside would suggest a test of resistance at 1.1534 (03/02/2015 reaction high).
GBP/USD has moved above its resistance at 1.5490 (29/04/2015 high) and is now challenging the resistance at 1.5620 (31/12/2014 high and 200d MA). Hourly support lies can be located at 1.5552 (intraday low and 26/02/2015 old resistance). In the longer-term, key resistance stands at 1.5552 (26/02/2015 high). However, the break of the strong support at 1.4814 opens the way for further medium-term weakness towards the strong support at 1.4231 (20/05/2010 low).
USD/JPY remains weak as long as prices remain below the key resistance at 120.10/20 (declining trendline). Hourly support stands at 119.20 (29/04/2015 high and intraday low) then 118.53. Another resistance is given by the recent high at 120.50 then 120.84 (13/04/2015 high).. A long-term bullish bias is favored as long as the strong support at 115.57 (16/12/2014 low) holds. A gradual rise towards the major resistance at 124.14 (22/06/2007 high) is favored. A key support can be found at 118.18 (16/02/2015 low), whereas a key resistance stands at 121.85 (see also the long-term declining channel)
USD/CHF has pulled back after the break of the resistance at 0.9276 (06/05/2015 high) then 0.9413 (30/04/2015 high). Lower support can be located at 0.9073 (07/05/2015 low). Another resistance can be seen at 0.9414 (05/05/2015 high). In the longer-term, the bullish momentum in USD/CHF has resumed after the decline linked to the removal of the EUR/CHF floor. A test of the strong resistance at 1.0240 is likely. As a result, the current weakness is seen as a counter-trend move. Key support can be found 0.8986 (30/01/2015 low).

