Get 40% Off
🚨 Volatile Markets? Find Hidden Gems for Serious OutperformanceFind Stocks Now

GPB/JPY And EUR/JPY: Daily Currency Outlook

Published 12/16/2014, 02:37 AM
Updated 03/09/2019, 08:30 AM

GBP/JPY Daily Outlook

Daily Pivots: (S1) 183.02; (P) 185.03; (R1) 186.22;

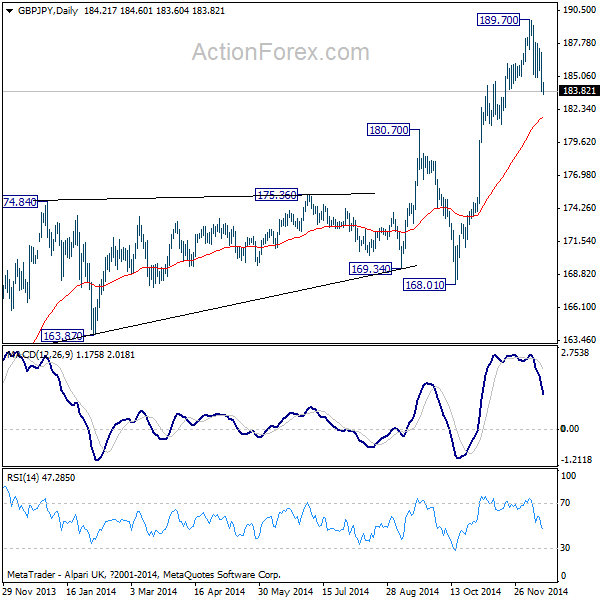
GBP/JPY's correction from 189.70 extended lower to 183.60 so far. Deeper decline could still be seen. But at this point, we'd expect strong support from 181.09, 38.2% retracement of 168.01 to 189.70 at 181.41, to contain downside and bring rebound. Above 187.04 will turn bias to the upside. But break of 189.70 is needed to confirm rally resumption. Otherwise, we'd expect more corrective trading in near term.

In the bigger picture, the up trend from 116.83 is still in progress for 61.8% retracement of 251.09 to 116.83 at 199.80, which is close to 200 psychological level. On the downside, break of 168.01 support is needed to confirm medium term topping. Otherwise, outlook will stay bullish in case of pull back.

GBP/JPY 4 Hours Chart

GBP/JPY Daily Chart

EUR/JPY Daily Outlook

Daily Pivots: (S1) 145.77; (P) 147.00; (R1) 147.74;

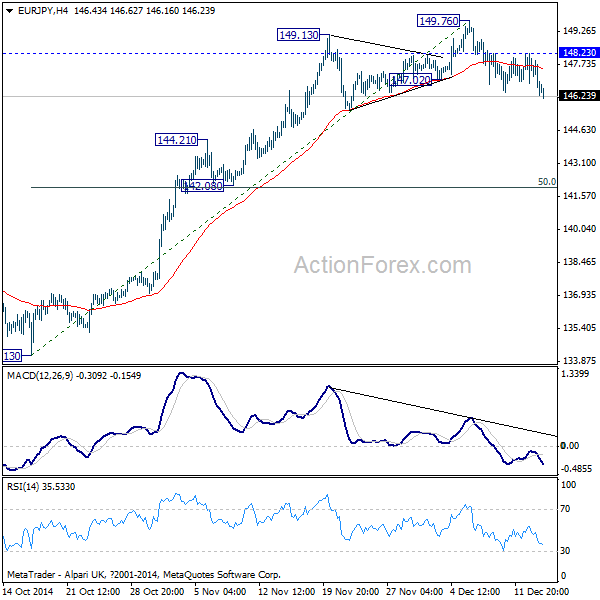
EUR/JPY's corrective fall from 149.76 extended and reached as low as 146.16 so far. Intraday bias remains on the downside for 144.21 support. At this point, we'd expect strong support from 142.08, 50% retracement of 134.13 to 149.76 at 141.94, to contain downside and bring rebound. On the upside, above 148.23 minor resistance will turn bias back to the upside. But break of 149.76 is needed to confirm rally resumption. Otherwise, we'd expect more corrective trading in near term.

In the bigger picture, the up trend from 94.11 long term bottom is still in progress for 76.4% retracement of 169.96 to 94.11 at 152.59 next. Break of 152.59 will target a test on 169.96 (2008 high). On the downside, break of 134.13 is needed to confirm medium term reversal. Otherwise, outlook will stay bullish.

3rd party Ad. Not an offer or recommendation by Investing.com. See disclosure here or remove ads .

EUR/JPY 4 Hours Chart

EUR/JPY Daily Chart

Latest comments

Risk Disclosure: Trading in financial instruments and/or cryptocurrencies involves high risks including the risk of losing some, or all, of your investment amount, and may not be suitable for all investors. Prices of cryptocurrencies are extremely volatile and may be affected by external factors such as financial, regulatory or political events. Trading on margin increases the financial risks.
Before deciding to trade in financial instrument or cryptocurrencies you should be fully informed of the risks and costs associated with trading the financial markets, carefully consider your investment objectives, level of experience, and risk appetite, and seek professional advice where needed.
Fusion Media would like to remind you that the data contained in this website is not necessarily real-time nor accurate. The data and prices on the website are not necessarily provided by any market or exchange, but may be provided by market makers, and so prices may not be accurate and may differ from the actual price at any given market, meaning prices are indicative and not appropriate for trading purposes. Fusion Media and any provider of the data contained in this website will not accept liability for any loss or damage as a result of your trading, or your reliance on the information contained within this website.
It is prohibited to use, store, reproduce, display, modify, transmit or distribute the data contained in this website without the explicit prior written permission of Fusion Media and/or the data provider. All intellectual property rights are reserved by the providers and/or the exchange providing the data contained in this website.
Fusion Media may be compensated by the advertisers that appear on the website, based on your interaction with the advertisements or advertisers.
© 2007-2024 - Fusion Media Limited. All Rights Reserved.