Today's Technical Report/Commentary:
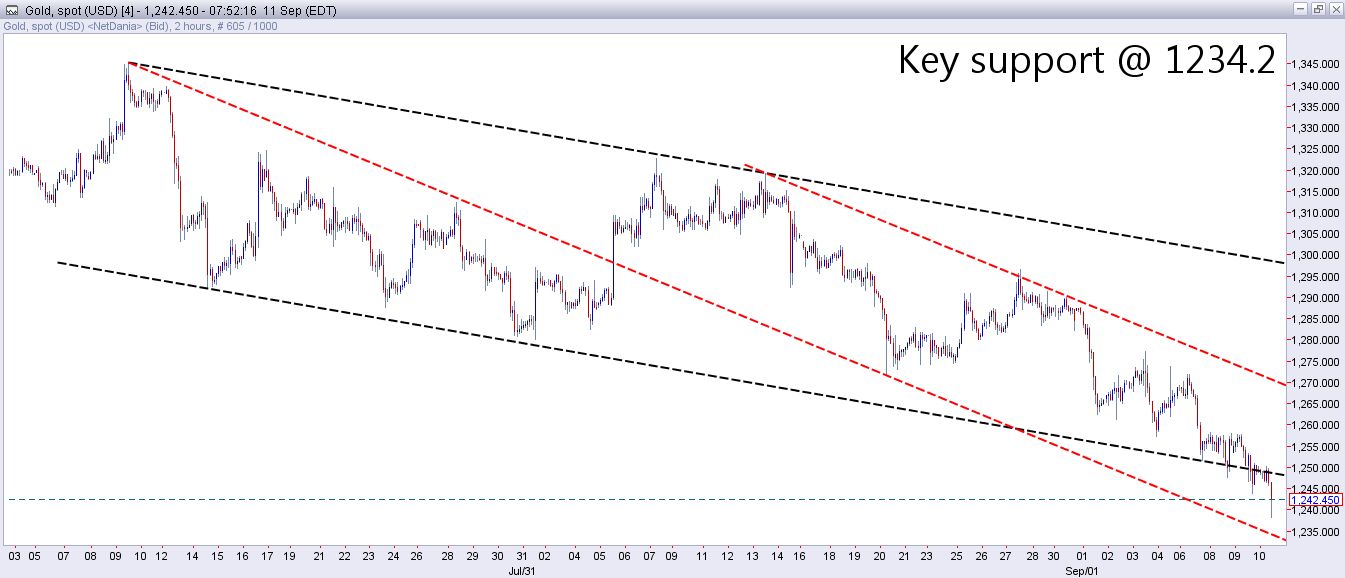
Gold has dropped to below the bottom of the first channel out of the 2 channels we have been watching recently (please refer to the attached chart). As said yesterday, this means that, we could be on the way lower, towards the bottom of the second channel, around 1234.2!
Today's current daily low 1238.2 is now important, because it can give an indication if the price is going to test 1234.2 or not. A break below the bottom of the second channel (which is 1234.2), would seriously hurt the medium term outlook, and although first target for such a break is 1224.6, potential medium term targets are much lower. If we do not find support at or above the bottom of the second channel, we should not be surprised to see gold testing the double bottom base around 1180.4, in the near future!
As for the resistance, first we have the falling trend line from yesterday's high at 1246.1. A break above this level will be a good start, but it will not mean a lot without breaking above the area which has been holding the precious metal down for the past 36 hours. Tuesday’s daily high was 1257.9, and Wednesday's high was 1257.6, and it is this small area that we need to clear in order to recover! A break above this area will target the falling trend line from Friday’s high, which seems to be running at 1263.2. A break above this level will open the way higher towards the short term retracement levels which start at 1266.8, but include more important levels at 1272.5 & 1278.1!
Chart:

Support:
• 1238.2: today's current daily low, which is one single pip above January 29th daily low & Marji bottom.
• 1234.2: January 14th daily low. This level is very close the bottom of the hourly channel, which can be drawn from August 14th daily high.
• 1231.5: January 22th daily low.
• 1224.6: November 24th 2013 daily low.
• 1218.5: January 7th daily low.
Resistance:
• 1246.1: the falling trend line from yesterday’s daily high.
• 1249.9: today's current daily high.
• 1257.6/9: the small area which holds Tuesday’s & Wednesday’s daily highs, and has capped 3 recovery attempts this week.
• 1260.5: short term Fibonacci 38.2% retracement level, calculated for the falling move from August 28th daily high & Fibonacci top 1296.5 to today’s 3-month low 1238.2.
• 1267.4: short term Fibonacci 50% retracement level, calculated for the falling move from August 28th daily high & Fibonacci top 1296.5 to today’s 3-month low 1238.2.
• 1274.2: short term Fibonacci 61.8% retracement level, calculated for the falling move from August 28th daily high & Fibonacci top 1296.5 to today’s 3-month low 1238.2.
• 1279.8: short term Marji 71.4% retracement level, calculated for the falling move from August 28th daily high & Fibonacci top 1296.5 to today’s 3-month low 1238.2.
Trend:
• Short term: Down, as long as the price is below 1257.6/9.
• Medium term: Down, as long as the price is below 1298.9.
• Long term: Down, as long as the price is below 1709.0.
Article originally appeared on MarjiFX.com
