Gold has been in correction now for three weeks -- if we can even call it three weeks, as this last one closed itself out yesterday (Friday) higher at 1302 despite having made a marginally lower intra-week low of 1277.
But what a difference a year makes, eh? Were this a year ago, Gold's recently having slipped under a "century mark" (1300) would by now most certainly have had price roar right down non-stop under the next one in turn (1200), for during 2013, Gold did not have the word "support" in its lexicon. Remember all those moaners and their mantra of "Gold is going down, Down, DOWN..."? Rubbish. I doubt "they'll' be singing Gold's praises when, after consolidating around this 1300 area, price goes a-dancin' above 1400 and on to 1500 as the year unfolds. At least such remains our expectation.
A week ago, we ranked Gold's year-to-date performance as being the strongest of the BEGOS Markets (Bond/Euro/Gold/Oil/S&P), and it still is, leading the pack now +8.1% with the Bond -- yes the Bond -- a distant second +3.9%. And did you happen to notice just how well Gold, rather than falling to bits, contained itself this past week in and around that oft-mentioned 1290-1275 support zone, first brought to light five missives ago on 01 March as follows: "...our stance remains for Gold to only mildly correct near-term (1290-1275) before moving more broadly onward in seek of 1466 (the bottom of "The Floor") perhaps by mid-year..."? Naturally in hindsight, "mildly" is now somewhat understated given Gold's then rapid, unsustainable rocket shot to 1392, the next visit to which ought be more measured and thus give better foundational substance for still higher levels.
Having said all that, Gold as 'twas quite obviously expected flipped its weekly parabolic trend from Long to Short, albeit price itself just completed its 12th up week in the last 15:
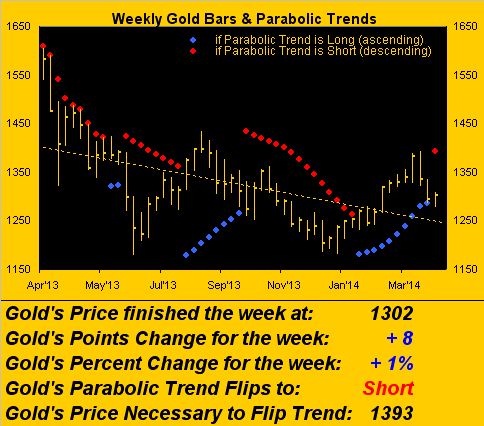
In fact, if Gold is simply going to consolidate 'round this current high-1200s/low-1300s area, the new parabolic Short trend depicted above by the rightmost red dot may itself be short-lived, as can happen with parabolics. For example, back in the "dark days" of 2013, there was a wee parabolic Long trend of just two weeks' duration which you can see above the "May'13" label. Historically specific to brief parabolic Short trends, there's precedence for several lasting only 3/4/5 weeks throughout the last decade. Therefore should Gold hold the line here -- and not work lower to bang about in the broader support area of 1280-1240 -- price ought well be prancing about the 1400s as early as May, and thus the notion of reaching "the bottom of The Floor" at 1466 by mid-year remains quite realistic.
Verily, the year is racing by at a frenetic pace, (a functional sensation of one's aging). Still, if it feels to you like New Year was just a month or so ago, consider this: with 65 trading days already in the 2014 books, 26% of the year has now passed. Fortunately to this point, Gold has not been beset upon by that selling cavalcade from midnight poltergeists, maddening beasties and maniacal Gold-hating hedgies such as we saw at all odd hours during 2013. To wit, through these first 65 trading days of the year, here we've Gold's comparative percentage plot of 2014 versus that of a year ago:
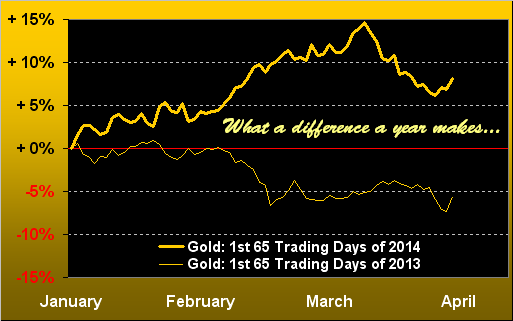
Admittedly in comparing Gold's track of this year to that of 2013, the wheels didn't really come flying off the Golden Chariot a year ago until Tax Day...
...which for 2014 is still better than a week away. So to justifiably make a "seasonal" assessment, we shall revisit those two comparative price tracks toward mid-year.
Either way, the makers of market mayhem may have finally had their "fill" of Gold, (quite a number of them indubitably spanked by Short-position losses -- serves 'em right, I say). In fact as we'll see at this missive's conclusion, their next Selling Assault Season might well be upon the S&P.
'Course when it comes to Gold, and certainly so fundamentally, 'tis always in season as long as world currency quantities continue to grow. One might go so far as to say that Gold ought simply rise in value as the world's population increases, given that more dough is needed to accommodate more people whilst the supply of the yellow metal remains largely fixed. Now add in the renewed callings for stimulus here, there and everywhere, and Gold is good to go.
Take China for example: its factories are struggling, such persistent weakness in manufacturing causing government leaders to issue increasingly clear signals that they plan another round of economic stimulus programs.
Meanwhile Across-the-Pond, the EuroZone's inflation, (their word for "economic growth"), has become so sufficiently tepid that expectations are for the European Central Bank to not only ease policy, but to so do with negative interest rates, or call on our old pal, quantitative easing.
And of course StateSide last Monday, seasonally or otherwise, Fed Chair Yellen also added accommodative seasoning in saying that her bank will maintain its stimulus for "some time". Maybe for all time, non? That's certain to relish Gold attraction. "Sheer magnetism, darling..."
Speaking of which, to Gold's Magnet we go. As you may recall from a week ago, Gold's reaching down toward the -50 area from its magnet level is typically excessive per the oscillator (price less magnet) at the foot of this next three-month chart. And thus, voilà...
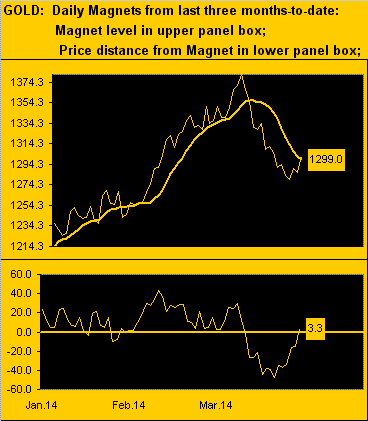
...price has snapped back up to the magnet, indeed having just penetrated above it, which technically points to higher prices near-term. With that in mind, we next we move on to a two-panel graphic -- arguably in conflict and positively so -- for Gold.
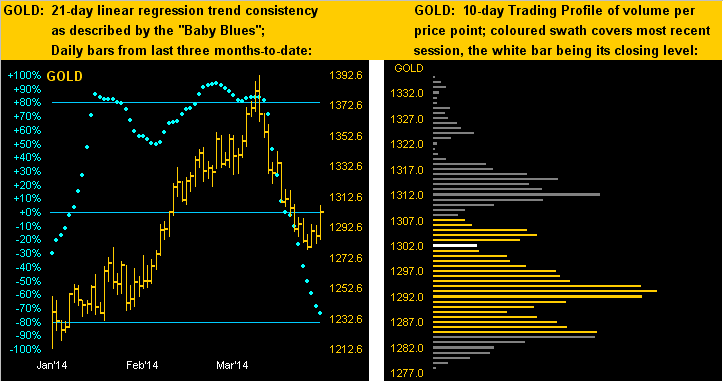
Below on the left we've Gold's daily bars, (essentially year-to-date), along with the blue dots, each one a measure of the prior 21-days' linear regression trend consistency. The "Baby Blues" appear poised to cross below the -80% level, which would confirm the trend as down, (as if we didn't already know that, given the uncanny steepness in Gold's movement this year, both up and down). But you can now see price already "making the turn", which at least to this juncture can be justified by the aforementioned 1290-1275 support zone's staving off lower levels. That brings us to the panel on the right of Gold's Market Profile. Note that the bulk of contract trading volume, (portrayed by the length of the horizontal price bars), is concentrated in that same support zone. This is the second time in 2014 that this area has seen significantly supportive high trading volume, such that should Gold again hold 'round here and then move well back up through the 1300s, the recent correction in retrospect shall already have ended:
Now before closing out this week's piece with a harrowing look at the S&P, let us turn briefly to Sleepy Sister Silver. Yes, "sleepy" is the apropos adjective for her of late. Adorned in her industrial metal jacket, Silver's growth so far this year (+2.7%), again as compared to Gold's +8.1%, has been really retarded by the deadweight (deadbeat?) S&P 500 (+1.0%). Indeed so much so that the white metal's EDTR ("expected daily trading range") has been reduced to just 41¢, the lowest level in at least a year. Here's the chart from the website:
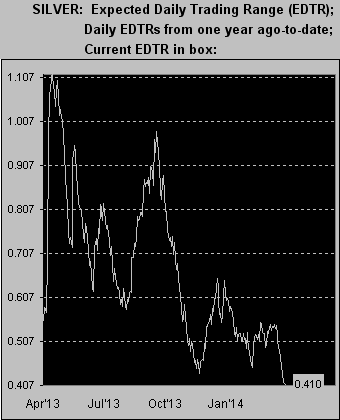
To be sure, across the BEGOS Markets spectrum, if any one component therein is due for a breakout, 'tis Silver. Currently at 19.995, Silver shows Market Profile support at 19.800. The question is: as the S&P "tanks", shall Sister Silver change into her precious metal pinstripes and breakout with Gold to the upside, or instead breakdown with the industrials?
"Well, mmb, given that kinda like gold, silver is money too, it's gotta be up eventually."
A wise observation there, Squire. And by the way, where the deuce have you been? No wait, I'd rather not know. (The charming chap's peregrinations tend to border toward the world's more seedy destinations). In any event as noted, let's close things out for this week with a lurid look at the S&P, for which we remain on "crash-watch".
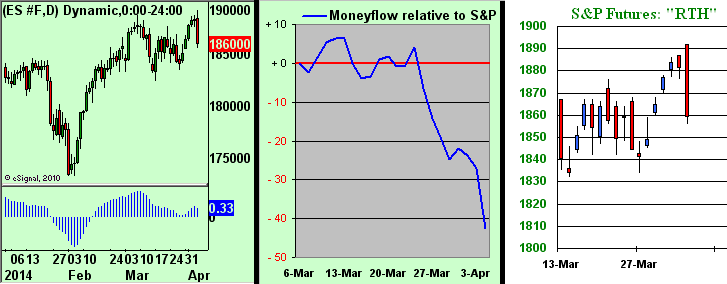
This is the stuff that you don't find on television because it portends poor days ahead for the stock market. As market negativity causes folks to tune out, turning FinMedia TV ratings lower, I've oft thought it verboten for broadcasters to be anything but bullish, (you know, the old "World Ends, But Dow Up 2" thing). Nonetheless here're the facts, ma'am, at least from our perch. The three-panel chart that follows is dauntingly telling.
To the left we've updated the price oscillator study on the S&P futures, (daily bars year-to-date), at which we looked last week. Recall that the blue bars at the chart's foot had all but gone negative? Then we got this past week's spritely rally, which was in turn hoovered in its entirety by a single blow yesterday, the last blue bar now lower, (uh-oh, part Un). In the center we've the last 21-days of the S&P's moneyflow relative to the Index itself (the red horizontal axis). The notion there is that the S&P (currently 1865) ought rather be 40 points lower to be in sync with the flow, (uh-oh, part Deux). To the right may be the most chilling chart of the bunch: 'tis the daily bars of the S&P futures only during RTH ("real-time hours") for the current contract (June) as "front month"-to-date. See that little happy-gappy run of blue days from six to two sessions ago? Never in memory have I noticed anything quite like that comparatively out-of-character goofy run over decades of watching this stuff. And again, then look what happened to it all yesterday, (rightmost red bar). That shows us just how powerful the selling forces are right now for a market that remains bizarrely overvalued on an earnings basis (29.6x p/e) and in which it seems there is just way too much over-investment for its dinky yield of 1.996% given that the 10-year T-Note's yield is 37% higher at 2.726% and without the risk of principal loss below par at maturity, (uh-oh, part Trois):
And remember: when it comes to markets, three "uh-ohs" don't guarantee a "ho-ho" but more likely an "Oh-No!" especially when the layman investor at large doesn't see it coming through these analyses.
That in mind, our deserving kudos to one shrewd Sheryl Sandberg in selling some 50% of her Facebook holdings. Perhaps she reads The Gold Update and thus is no doubt materially lightening up her equities' holdings ahead of the Faceplant.