Gold and gold miners have rebounded but remain in a technically weak position. Both markets have failed to move beyond the highs made last Friday. The same happened to the gold stocks in early October. They exploded higher one day but failed to muster anything after that. At that time Gold continued its rally for a few weeks. This time Gold has struggled to sustain Friday’s gains. While we are coming to the end of the bear market and one should not be too bearish, the downside target of $1000/oz Gold remains well in play.
2 Key Levels
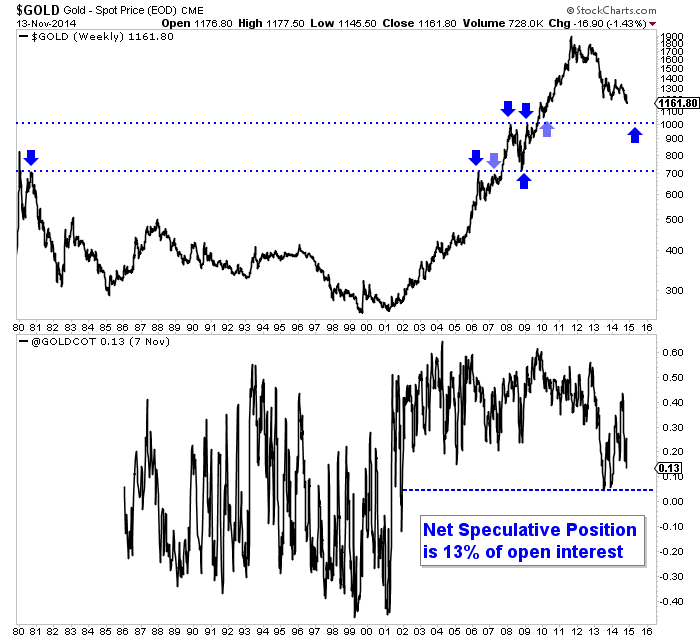
The chart below shows the weekly Gold close since 1980 and the net non-commercial (speculative) position as a percentage of open interest. From this chart we can deduce the two most important levels: $720/oz and $1000/oz. Give or take $5/oz, $720/oz was the secondary peak in 1980, the peak in 2006, small resistance in 2007 and major support in 2008. Gold’s bottom in 2008 wasn’t random. It bottomed at an important pivot point around $700/oz. Today, Gold is in a downtrend without any major support until the $1000/oz level. That level marked important support and resistance from 2008 to 2010 and is the next major support.

As a percentage of open interest, the net speculative position is 13%. It’s low of 5% in 2013 marked an 11-year low. If Gold declines near $1000/oz, I’d bet the net speculative position would fall below 5% and reach a 13-year low. That qualifies as extreme bearish sentiment. The physically backed ETFs (ARCA:CEF) and (AMEX:GTU) are already showing sentiment at major multi-year extremes.
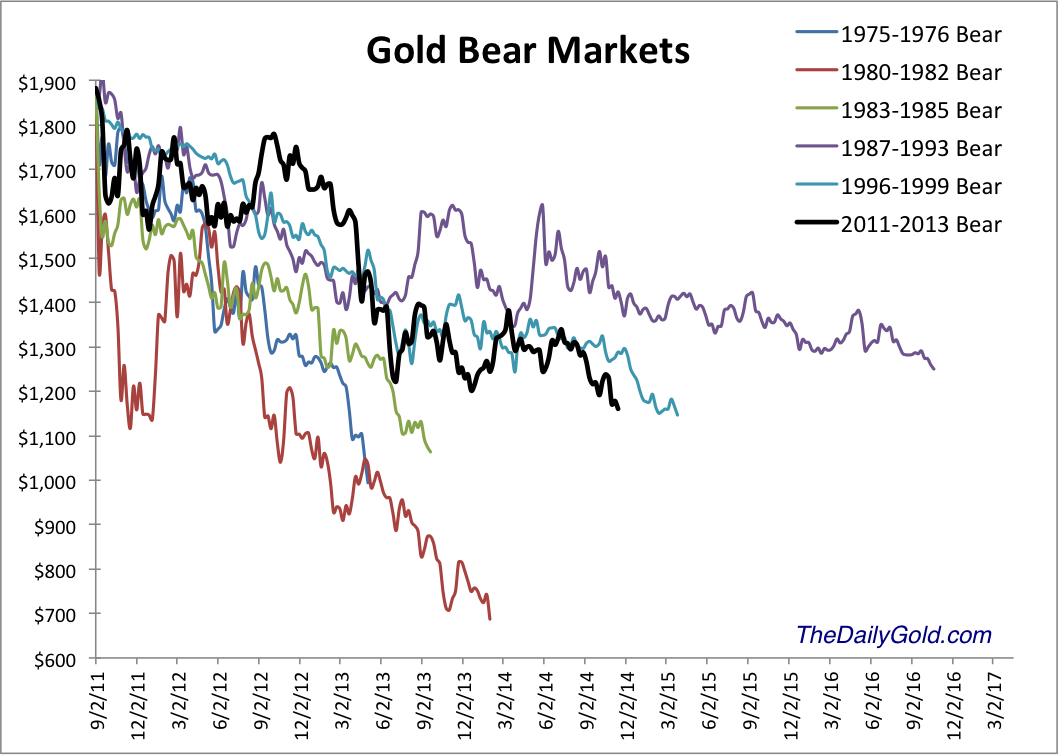
The $1000/oz target expressed above also fits very well with history as we’ve shown numerous times in this bear analog chart.

While the downside for Gold and Silver may be limited (in percentage terms), the downside for miners could be quite a bit more. With Gold trading at $1160/oz, it would have to fall about 13% to reach $1000/oz. That is not so bad if you hold Gold. However, a 13% fall in Gold could cause a 20% fall in the miners or more. If a gold producer has a $200 profit margin at $1200/oz then he does not have much profit at $1050 Gold. If a junior has a deposit that can earn good money at $1300/oz then that isn’t worth much if Gold drops to $1050. Thus, a fair amount of downside potential remains in play. On the other hand, it works in your favor if you buy very low and Gold recovers.
Almost Done
In any event, the bear market is very close to its end. The weeks and months ahead figure to be enticing and exciting for precious metals traders and investors. Expect quite a bit of day to day volatility as we see forced liquidation and occasional short covering. Opportunities are fast approaching so pay attention. Be patient but be disciplined. As winter beckons we could be looking at a lifetime buying opportunity. I am working hard to prepare subscribers.
