Albert Einstein's popular description of insanity is the execution of "doing the same thing, over and over again, but expecting different results”, which one might suppose if done in perpetuity could well lead to one's own execution, whether (heaven forbid) self-inflicted, else by sinister forces. Further, in applying Thomas Magnum's pet phrase, "I know what you're thinking...", each Saturday in the pre-dawn hours, mmb arises, deftly pulls together the best of his analytics and in then transforming them into prose, makes the case for substantially higher Gold prices, only to see them flag and sag over and over again. Repetitious Insanity? I hope not, for if 'tis, then I'll likely have to move on to mumbling the monastic vows, (which given that the denizens of Lerins Abbey just down the coast from Monaco on the Mediterranean's wee Île Saint-Honorat produce some 30,000 bottles of wine per year, would not be that reclusive of a lifestyle).
As for present insight, desert greetings from Arizona, where analogous to Gold, when it rains here it pours, as has been the wont of not just the yellow metal, but of late for other Dollar-denominated markets as well. For as the world goes gaga in getting stuck on the Buck, all else is abandoned amok: oxymoronic "Dollar strength" has everything -- certainly that we follow -- on the run. Of course, we stand firmly confident that such Dollar devotion is hardly true love; rather 'tis like a temporary dalliance of innocent infatuation, a "crush" that really ought not crush Gold. Regular readers of The Gold Update know of price's double-digit percentage rise alongside same for the Dollar Index during a six-month streak back in 2010, not to mention the better than 50% price rise from 2004-2006 in stride with the Fed Funds rate simultaneously increasing from 1% to 5%. Rational Insight? I hope 'tis that of Gold's being uncannily undervalued given the proliferation of foundation-less fluff worldwide, furthered by Shorting on the part of those who do not actually possess the yellow metal.
To be sure, we'd have more concern for a negative impact on Gold by the Dollar's so-called "strength" were its supply, as measured by "M2", not to have proliferated since the 1980's better than six-fold, which per our recent study -- wherein we even diluted the value of Gold to account for its own supply increase -- puts our appraisement for price at $2,077/oz. (as descriptively calculated in the 30 August missive). Similarly, we'd have more concern of a negative impact on Gold by the stock market's stunning strength these past six years were our "live" price/earnings ratio of the S&P 500 currently not 36.2x. Oh the market did have some volatile moments this past week ... essentially peanuts from our perspective. The already dramatic Dollar debasement and the ridiculous risk of the bubblicious S&P ought ultimately redound positively to a currency called Gold as, perhaps to steal that popular stock market phrase from recent years, "There's no place else to put your money." Would not that be something! A baby one-gram Gold bar ($44) could cover that quick trip to the store, your change being denominated in silver coins. 'Course, rather than be burdened by carrying about the actual specie, I'd suspect there'd be an app for that.
In any event, with our man Squire again manning the "mainframes" up in San Francisco toward getting the images to us, let us commence with this stark BEGOS Markets display of "everything is down". Here are those markets for the last 21 trading days (one month) with their respective baby blue dots indicative of the consistencies of the diagonal linear regression trend lines, all of which are now slanting down, including that for the S&P 500 ("SPOO" futures). Note for Gold the encircled rightmost "Baby Blue" which in just ratcheting up would, per our database, generally herald a change in trend as being nigh:
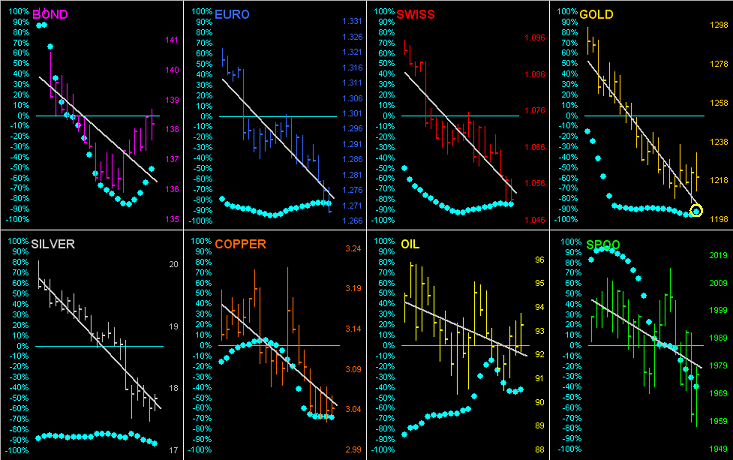
"And I ran the stuff for the Dollar Index too, mmb!"
Aye, Squire, and it starkly shows us the Dollar as the rub, indeed as the fun. Well done, son:
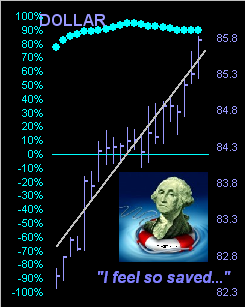
But in keeping all this doting on the Dollar in context, its Index even now at 85.780 being +5% year-to-date nonetheless does not preclude that 'tis still -48% from its all-time high (164.720) back in 1985. Moreover, given the aforementioned massive multiplying of Dollar supply per M2, the Index likely'd be lower still, were it not for the mutual debasing of other currencies.
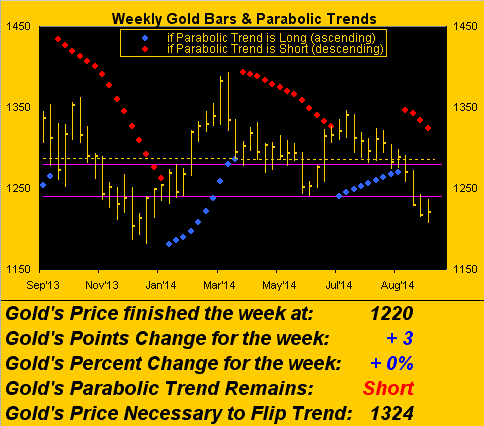
As for Gold, to further our description from a week ago, it simply remains technically negative and thus subject to the selling pressure of the Shorts, (although you may have seen how quickly they are to flee, to wit Gold's swiftly rising 21 points in our wee hours on Tuesday, and then after settling back down, its 17-point leap in less than two hours on Thursday). The good news within these throes of the current parabolic Short trend is that price clearly got a grip during the week, rather than succumb to going over the falls toward testing at least the year's low (1203) let alone that of last year (1180). And you know how it goes with markets: if 'tis so obvious that such levels will trade, they oft ironically shan't. Indeed as we look below at the year-over-year weekly bars, should price in a week's time be at least back between the purple lines -- which rightly we now term as a resistance band rather than one of support -- the lowest levels for this parabolic Short trend may already have been reached. Again, Gold's most recent baby blue dot that we saw above in our first chart has just popped up a pip. Now let's see if price can provide some pop of its own in the ensuing week:
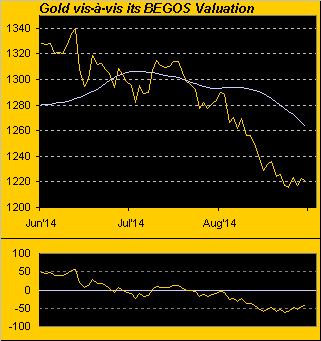
Next we zoom in on Gold's closing prices for the past three months along with its smooth, pearly valuation line, (borne of price's changes relative to those that make up the primary BEGOS Markets of the Bond/Euro/Gold/Oil/S&P). The smooth line, albeit falling, is almost 50 points higher than is Gold itself as calculated by the oscillator (price less value) at the foot of the graphic. And furthermore, the gap via the oscillator has ceased widening:
Next let's bring up, (or perhaps better stated bring "down"), the Economic Barometer as charted for the last 12 months along with the S&P 500. Is the Econ Baro, too, now feeling the early brunt of "Dollar strength"?
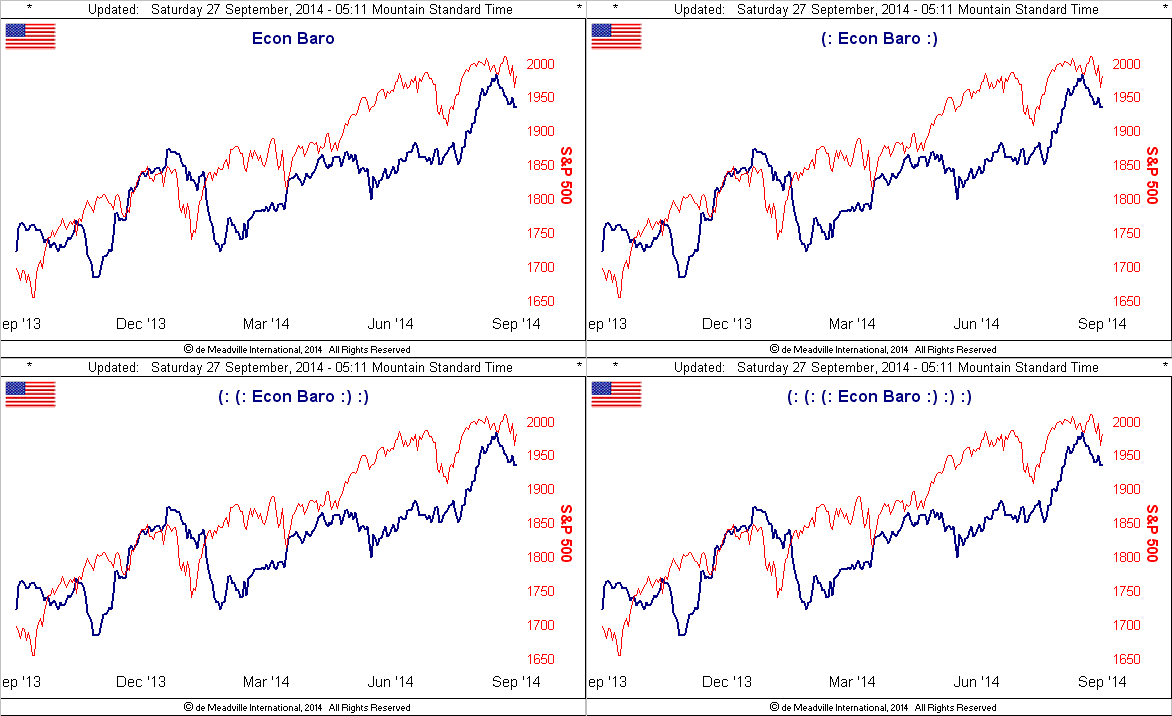
It does further the questioning: is this merely Baro "noise", or has the tapering of Quantitative Easing by the Federal Reserve Bank begun to erode recent economic strength, as least as presented by the Baro? Is the end of QE going to appear as terribly timed? Taking it a question further, was it first "them" and now "us"?
"Them" refers to the EuroZone as business growth across the pond dipped during September to the year's low, with companies again cutting prices. France's own Purchasing Managers Index is declining, which ought be further perpetuated given the ongoing pilots' strike at "Air Chance". And for the Zone as a whole, wherein lending is weak, European Central Bank President Mario Draghi mid-week reiterated for the nth time that their policy would remain accommodative for as long as it takes to drive inflation up nearer to a 2% rate. Europe is fragile. Are we just now beginning to so become StateSide? Or is the Baro above just taking a breather? We know that seasonally, this is a typically tough time for our stock market, or is there more to the story as the Fed's punch bowl is all but drained and we'll have to return to valuing stocks the old-fashioned way: by earnings! Gulp... Surely, as has been the case for many-a-month, the yield on the U.S. 10-Year Treasury Note (2.535%) clearly exceeds that which we calculate for the S&P (2.033%). So: out of equities and into debt? (There'd really go the FinMedia TV ratings). Or out of both and into Gold? Obviously ownership of equities and debt shan't become altogether passé, but a doubling of Gold ownership in portfolios would certainly reduce some of the current insanity given a dose of insight.
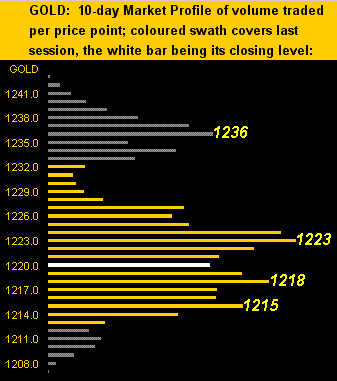
We'll put a wrap on it here with Gold's 10-day Market Profile followed by The Gold Stack. You can see price having settled out the week yesterday (Friday) as the nestled white bar (1220) within a protective clump of the high volume trading range between 1223 and 1215 which lends some positive assurance to the picture. The upside goal per this view would be to settle above the 1236 apex, thus setting the stage to at least crawl back up into the 1240-1280 resistance zone at which we earlier looked in the weekly bars chart:
The Gold Stack:
Gold’s All-Time High: 1923 (06 September 2011)
The Gateway to 2000: 1900+
The Final Frontier: 1800-1900
The Northern Front: 1750-1800
On Maneuvers: 1579-1750
Structural Resistance: 1479 / 1524-1535
The Floor: 1466-1579
Le Sous-sol: Sub-1466
Year-to-Date High: 1392
Base Camp: 1377
The Weekly Parabolic Price to flip Long: 1324
The 300-day Moving Average: 1295
Neverland: The Whiny 1290s
Resistance Band: 1240-1280
10-Session directional range: 1243 down to 1207 = -36 points or -3%
10-Session “volume-weighted” average price magnet: 1224
Trading Resistance: 1223 / 1236
Gold Currently: 1220, (weighted-average trading range per day: 16 points)
Trading Support: 1218 / 1215
Year-to-Date Low: 1203
Structural Support: 1163 / 1145
Last, but hardly least, a tip of the cap to India, whose Gold holdings purportedly rank 10th on the planet and whose annual Gold net purchasing on balance has accelerated it into at least the Top Two alongside purchases made by China. And now India having also accelerated off into deep space has placed its Mangalyaan orbiter 'round Mars, saunteringly encircling the red planet once every three "earth" days, (72 hours). Further, India is not only up in its Gold purchases, is not only up in space, but is now also up in the eyes of S&P, having just raised the republic's sovereign credit rating from negative to stable. You cannot help but admire the correlation of trends here: stability in credit, stability in orbit, and stability in Gold. And all at a time with the opportunity to grab some more Gold -- based upon the level of the StateSide M2 money supply -- at what again by our calculation is well below "book value" prices! Now let's see, if like India, Gold can launch itself a bit in the new week.