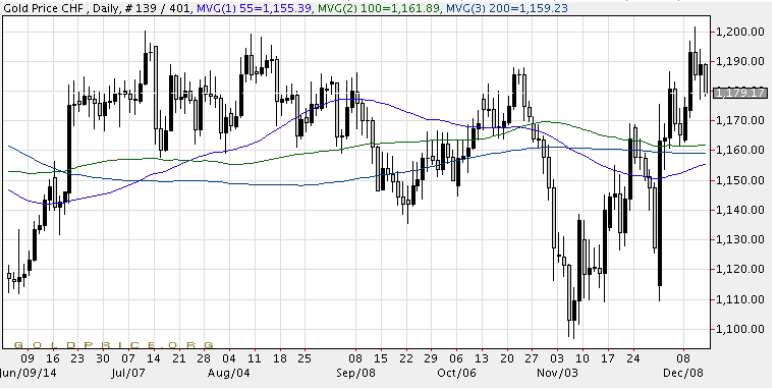
Gold prices declined slightly over 2014 as losses in the year’s final day of trading prevented the metal from merely breaking even on an annual basis. Gold for February delivery up $3.20, or 0.28%, to settle at $1,187.20 an ounce on the New York Mercantile Exchange. It hit a session high of $1,188.30 an ounce but not sustain on that level. For the year, gold prices declined 1.5%, compared with the Dec. 31, 2013, settlement price of $1,202.30 an ounce. Gold prices have tumbled from $1,379 an ounce earlier this year, or 14%, dragged down by sluggish demand from Asia and a stronger dollar.
Global gold demand near 5-year low in Q3 2014, India overtakes China - WGC
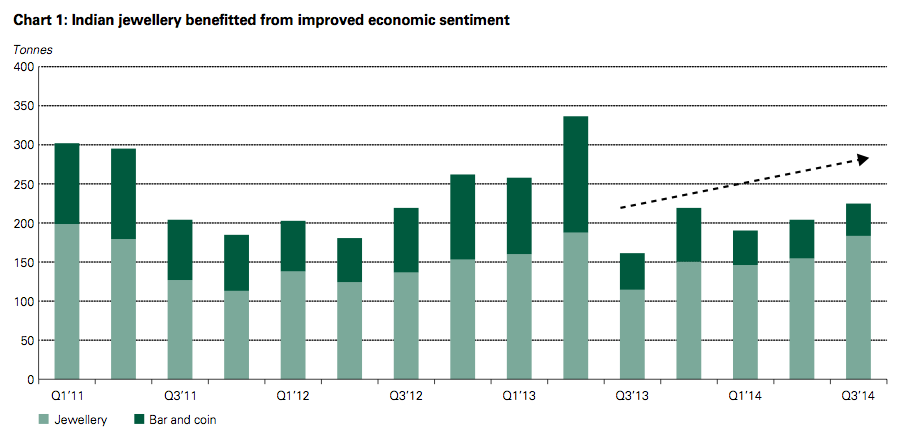
Global gold demand fell to its lowest in nearly five years in the third quarter as Chinese buying slid by a third, the World Gold Council said on Thursday, putting it back behind India as the world's biggest gold consumer. Total gold demand fell 2 percent to 929 tonnes in the third quarter. Last year's number one consumer China saw a 39 percent drop in jewellery consumption as well as a 30 percent fall in bar and coin investment. Combined demand fell 37 percent. India once again took over as the world's biggest gold consumer, buying 225.1 tonnes of gold jewellery, coins and bars last quarter, compared to 182.7 tonnes in China. India, which lost its crown as the leading gold buyer to China in 2011, saw a 60 percent surge in jewellery demand in the third quarter.
Jewelry Demand Q3 2014

The 4% drop in total global jewelry demand still reflects the activity seen in the gold market in the third quarter of 2013, the WGC said, when third quarter demand was at its highest since 2008. Compared to the five-year average, third-quarter jewelry demand is marginally stronger. India’s jewelry demand was the engine behind global sales, the WGC said, as third-quarter Indian gold jewelry demand was 182.9 metric tons, up from 114.5 tons in the third quarter of 2013. The gain came from a strong demand for jewelry during the Diwali festival, along with improved optimism toward India’s economy in general and the relaxation of import tariffs by the Reserve Bank of India.
Short Term Technical Trend

Gold was trading below 50 days SMA $1200 from over the last 3 weeks, it’s a little negative sign for short to medium term. Fresh bearish down Bollinger band® open below $1165.You can see more selling pressure level below $1153 if gold breaks its crucial support $1165 and close to it. On monthly technical chart US gold created a format of rectangle triangle in a down trend it indicated gold short term bearish trend will continue below near main resistance $1198. You can see more upside target above $1206 and $1214 if gold cross near main resistance $1198.Short term traders sell gold at every high with given SL for target $1173 and $1165
