Yellow metal hit a high of 1,331.26 yesterday, but bulls were unable to hold onto the gains with prices pulling back to 1,325 quickly towards the end of US session. This is not surprising considering that market sentiment was bullish yesterday, draining away the safe-haven flows that has helped prices gaping from 1,318+ to 1,328 during Monday open.
Not only was stock market bullish, the war drum has just gotten softer as well as interim Ukrainian President Oleksandr V. Turchynov failed to enforce the ultimatums given to the pro-Russia dissenters to give up arms, opting to seek the United Nations for peacekeeping efforts instead of deploying "counter terrorism" military operations which the President threatened to do on national TV. Certainly this passive response is not good for Ukraine as such a timid response is likely to invite more aggressive behaviors from those pro-Russian militia. However, this also means that Russia has less reasons to send troops into Ukraine, delaying any scenario of outright war between the 2 nations occurring and thus dragging Gold prices lower.
Daily Chart

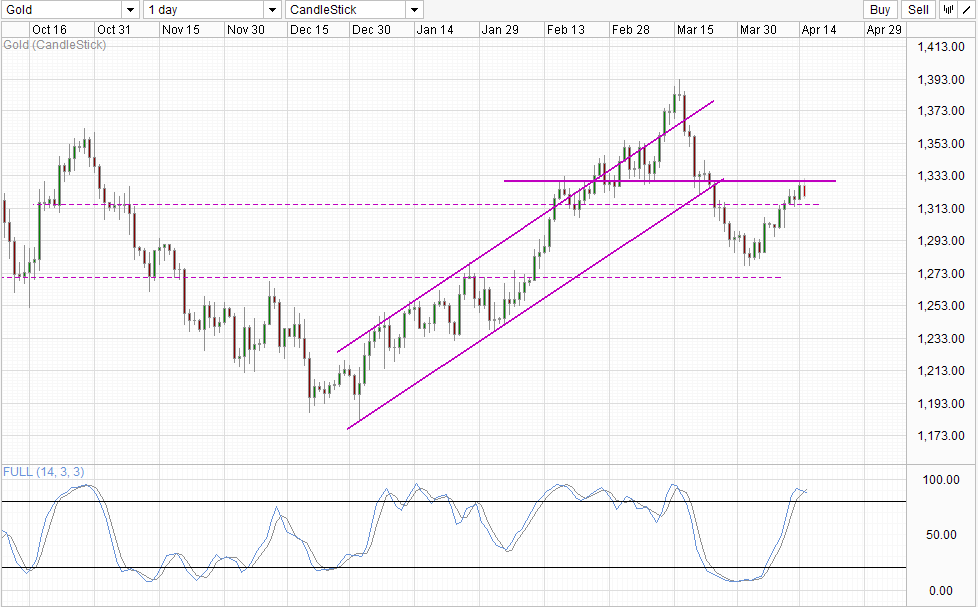
Given the 2 factors above, it is no wonder that Gold prices failed to breach the 1,330 resistance. The more important question is whether this failure will spark a deeper bearish correction or will it simply be a temporary blip versus the strong bullish momentum that has been in play since early April. Looking at Stochastic indicator, the former may be more likely as Stoch curve has crossed the signal line, with a bearish signal potentially forming soon should prices trade closer to the 1,315 support level.
However, from a momentum perspective, the uptrend from April has not be invalidated, and as such the likelihood of 1,315 holding remains and we could easily see a retest of 1,330 soon enough if market remains bullish on Gold. Considering that 2014 has been bullish for Gold, the S/T bullish uptrend becomes stronger, in fact favoring a break of 1,330 which opens up Channel Bottom as a potential bullish target.
Hourly Chart

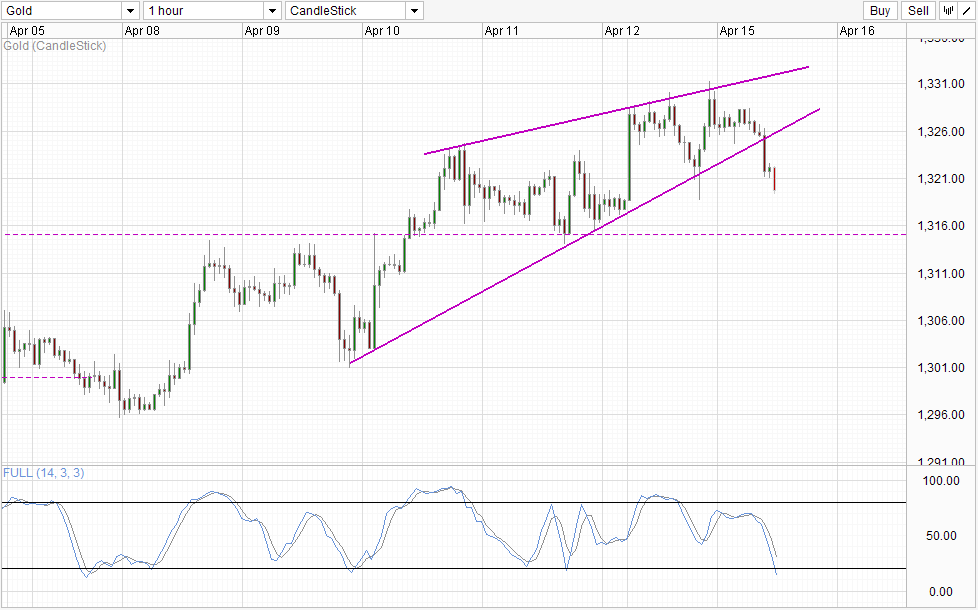
Short-term technicals reflects the same bullishness, with stochastic indicator already within the Oversold region before 1,315 is tested. Certainly prices is bearish in the immediate S/T with the break of lower Wedge, but does not invalidate the uptrend that has been in play since 8th April, hence lending strength to the 1,315 support and echoing the notion that the April uptrend seen on Daily Chart above remains in play.
That being said, traders should take note that L/T direction for Gold remain bearish, and in fact 2014 itself can be considered as a corrective year versus the strong bear trend which has started since 2011 September. Furthermore, long-term fundamentals do not favor inflated Gold prices as the Federal Reserve has started to taper its QE program which is expected to come to its conclusion by the end of 2014. Compared to this all the bullish factors are merely incidental and unlikely to muster any sustained push.
